29
/
en
AIzaSyAYiBZKx7MnpbEhh9jyipgxe19OcubqV5w
April 1, 2024
45587
Low & middle income
LMY
false
2
1
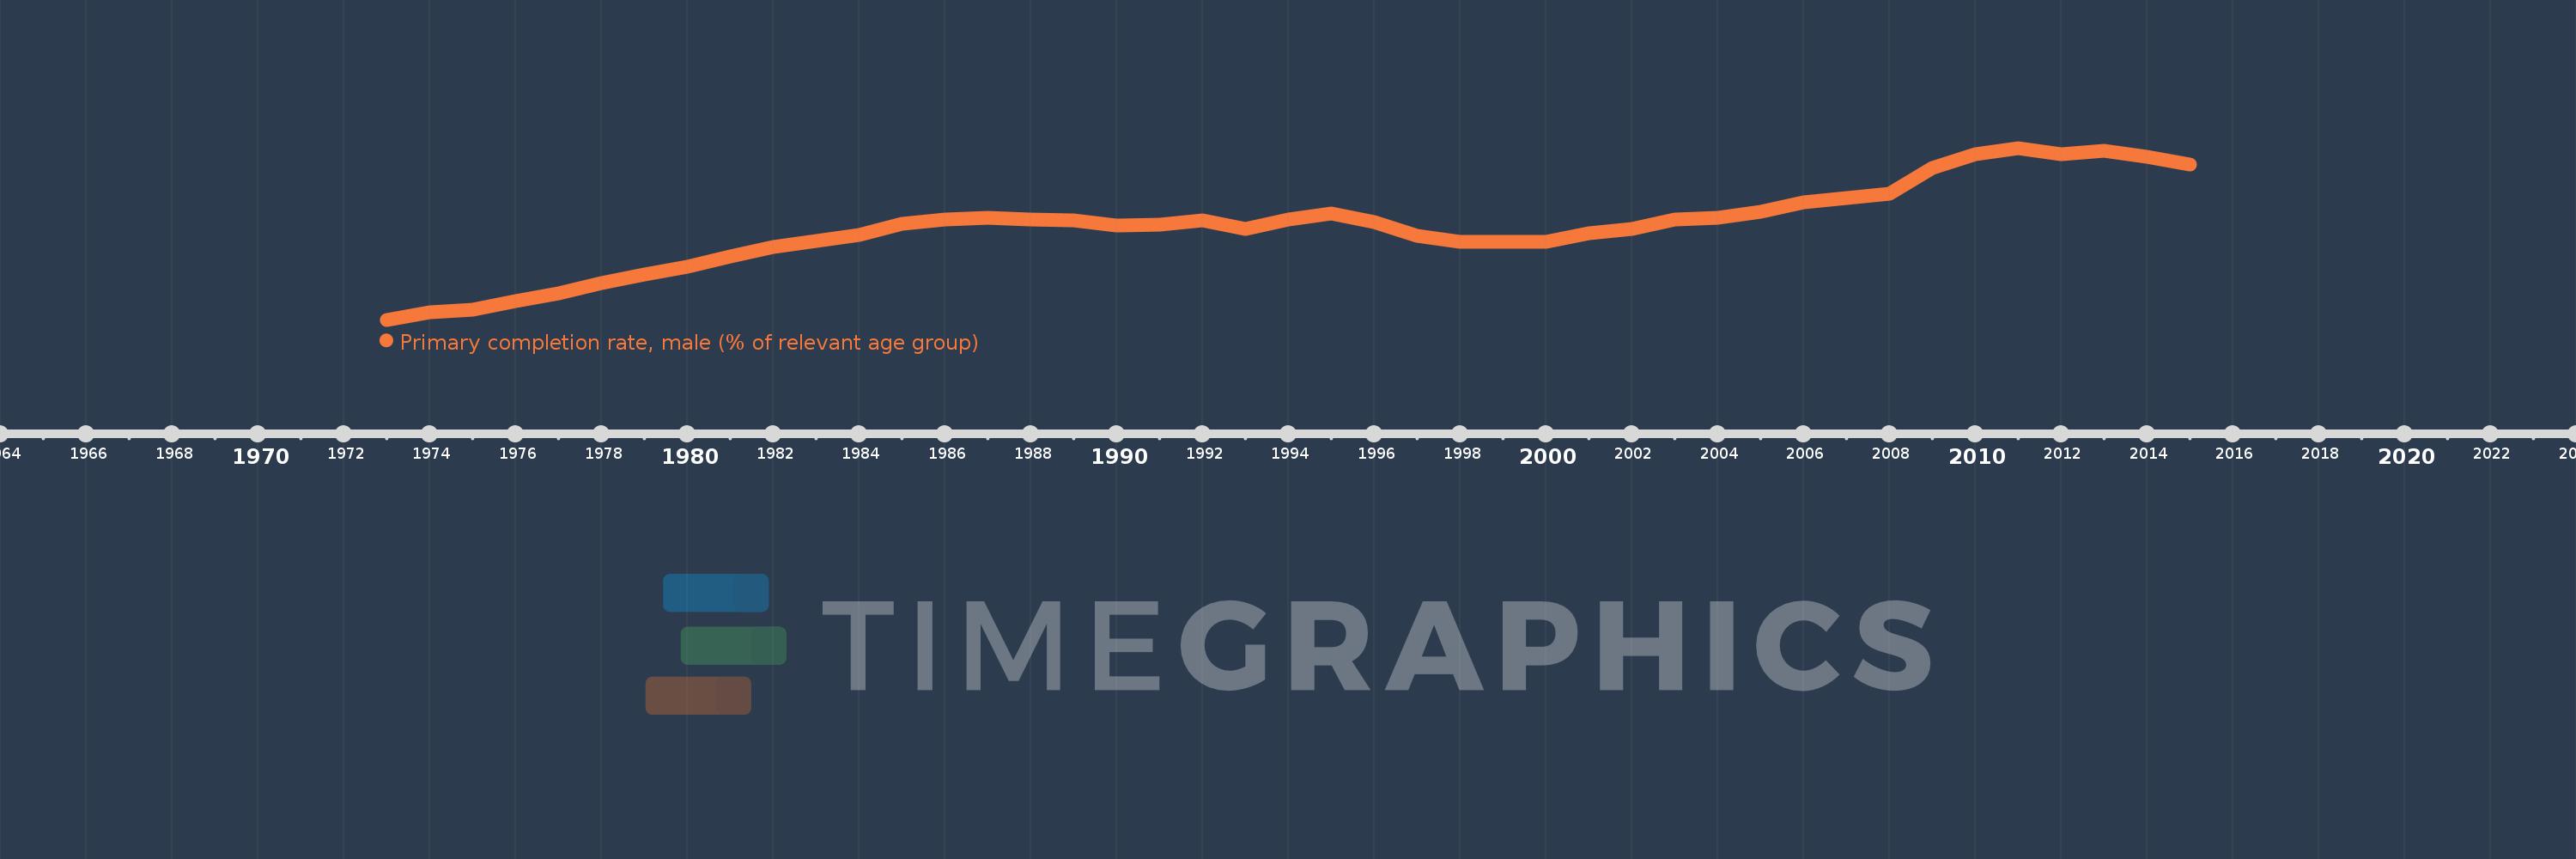
Primary completion rate, male (% of relevant age group)
2015,2014,2013,2012,2011,2010,2009,2008,2007,2006,2005,2004,2003,2002,2001,2000,1999,1998,1997,1996,1995,1994,1993,1992,1991,1990,1989,1988,1987,1986,1985,1984,1983,1982,1981,1980,1979,1978,1977,1976,1975,1974,1973
This statistics in other country:
AfghanistanAlbaniaAlgeriaAngolaAntigua and BarbudaArab WorldArgentinaArmeniaArubaAustriaAzerbaijanBahamas, TheBahrainBangladeshBarbadosBelarusBelgiumBelizeBeninBermudaBhutanBoliviaBosnia and HerzegovinaBotswanaBrunei DarussalamBulgariaBurkina FasoBurundiCabo VerdeCambodiaCameroonCanadaCaribbean small statesCentral African RepublicCentral Europe and the BalticsChadChileChinaColombiaComorosCongo, Dem. Rep.Congo, Rep.Costa RicaCote d'IvoireCroatiaCubaCyprusCzech RepublicDenmarkDjiboutiDominicaDominican RepublicEarly-demographic dividendEast Asia & PacificEast Asia & Pacific (excluding high income)East Asia & Pacific (IDA & IBRD countries)EcuadorEgypt, Arab Rep.El SalvadorEquatorial GuineaEritreaEstoniaEthiopiaEuro areaEurope & Central AsiaEurope & Central Asia (excluding high income)Europe & Central Asia (IDA & IBRD countries)European UnionFijiFinlandFragile and conflict affected situationsFranceGabonGambia, TheGeorgiaGermanyGhanaGreeceGrenadaGuatemalaGuineaGuinea-BissauGuyanaHaitiHeavily indebted poor countries (HIPC)High incomeHondurasHong Kong SAR, ChinaHungaryIBRD onlyIcelandIDA & IBRD totalIDA blendIDA onlyIDA totalIndiaIndonesiaIran, Islamic Rep.IraqIrelandIsraelItalyJamaicaJapanJordanKazakhstanKenyaKiribatiKorea, Dem. People’s Rep.Korea, Rep.KuwaitKyrgyz RepublicLao PDRLate-demographic dividendLatin America & Caribbean Latin America & Caribbean (excluding high income)Latin America & the Caribbean (IDA & IBRD countries)LatviaLeast developed countries: UN classificationLebanonLesothoLiberiaLibyaLiechtensteinLithuaniaLow & middle incomeLow incomeLower middle incomeLuxembourgMacao SAR, ChinaMacedonia, FYRMadagascarMalawiMaldivesMaliMaltaMarshall IslandsMauritaniaMauritiusMexicoMiddle East & North AfricaMiddle East & North Africa (excluding high income)Middle East & North Africa (IDA & IBRD countries)Middle incomeMoldovaMongoliaMontenegroMoroccoMozambiqueMyanmarNamibiaNauruNepalNetherlandsNew ZealandNicaraguaNigerNigeriaNorwayOECD membersOmanOther small statesPacific island small statesPakistanPalauPanamaPapua New GuineaParaguayPeruPhilippinesPolandPortugalPost-demographic dividendPre-demographic dividendQatarRomaniaRussian FederationRwandaSamoaSan MarinoSao Tome and PrincipeSaudi ArabiaSenegalSerbiaSeychellesSierra LeoneSlovak RepublicSloveniaSmall statesSolomon IslandsSouth AfricaSouth AsiaSouth Asia (IDA & IBRD)South SudanSpainSri LankaSt. Kitts and NevisSt. LuciaSt. Vincent and the GrenadinesSub-Saharan Africa Sub-Saharan Africa (excluding high income)Sub-Saharan Africa (IDA & IBRD countries)SudanSurinameSwazilandSwedenSwitzerlandSyrian Arab RepublicTajikistanTanzaniaThailandTimor-LesteTogoTongaTrinidad and TobagoTunisiaTurkeyTuvaluUgandaUkraineUnited Arab EmiratesUpper middle incomeUruguayUzbekistanVanuatuVenezuela, RBVietnamWest Bank and GazaWorldYemen, Rep.ZambiaZimbabwe Timeline:
This timeline shows a graph from 1973 to 2015 of Low & middle income. No data until 1972. Number of actual observations by date: 43.
Source name:
World Development Indicators
Source organization:
United Nations Educational, Scientific, and Cultural Organization (UNESCO) Institute for Statistics.
Categories, topics:
Education, Gender
Last updated:
apr 23, 2017
Indicators value changes by year
Minimum:
75.509
jan 1, 1973
Maximum:
91.174
jan 1, 2011
At the date of observation
Value
Absolute change
Change from previous value
jan 1, 1973
75.509
+75.509
0.0%
jan 1, 1974
76.166
+0.657
0.87%
jan 1, 1975
76.444
+0.277
0.36%
jan 1, 1976
77.212
+0.769
1.01%
jan 1, 1977
77.934
+0.721
0.93%
jan 1, 1978
78.819
+0.886
1.14%
jan 1, 1979
79.625
+0.806
1.02%
jan 1, 1980
80.355
+0.73
0.92%
jan 1, 1981
81.269
+0.914
1.14%
jan 1, 1982
82.136
+0.867
1.07%
jan 1, 1983
82.664
+0.528
0.64%
jan 1, 1984
83.241
+0.577
0.7%
jan 1, 1985
84.283
+1.042
1.25%
jan 1, 1986
84.679
+0.397
0.47%
jan 1, 1987
84.799
+0.12
0.14%
jan 1, 1988
84.612
-0.186
-0.22%
jan 1, 1989
84.589
-0.023
-0.03%
jan 1, 1990
84.102
-0.487
-0.58%
jan 1, 1991
84.202
+0.1
0.12%
jan 1, 1992
84.538
+0.336
0.4%
jan 1, 1993
83.827
-0.711
-0.84%
jan 1, 1994
84.62
+0.793
0.95%
jan 1, 1995
85.183
+0.563
0.67%
jan 1, 1996
84.416
-0.767
-0.9%
jan 1, 1997
83.173
-1.243
-1.47%
jan 1, 1998
82.629
-0.544
-0.65%
jan 1, 1999
82.628
-0.001
0.0%
jan 1, 2000
82.59
-0.038
-0.05%
jan 1, 2001
83.422
+0.832
1.01%
jan 1, 2002
83.827
+0.405
0.49%
jan 1, 2003
84.67
+0.843
1.01%
jan 1, 2004
84.839
+0.168
0.2%
jan 1, 2005
85.376
+0.537
0.63%
jan 1, 2006
86.233
+0.856
1.0%
jan 1, 2007
86.627
+0.394
0.46%
jan 1, 2008
87.012
+0.385
0.44%
jan 1, 2009
89.356
+2.344
2.69%
jan 1, 2010
90.609
+1.254
1.4%
jan 1, 2011
91.174
+0.565
0.62%
jan 1, 2012
90.601
-0.573
-0.63%
jan 1, 2013
90.877
+0.276
0.31%
jan 1, 2014
90.351
-0.527
-0.58%
jan 1, 2015
89.666
-0.685
-0.76%
Ranking of countries by current statistics by years


Comments: