29
/
en
AIzaSyAYiBZKx7MnpbEhh9jyipgxe19OcubqV5w
April 1, 2024
57577
South Asia
SAS
false
2
1
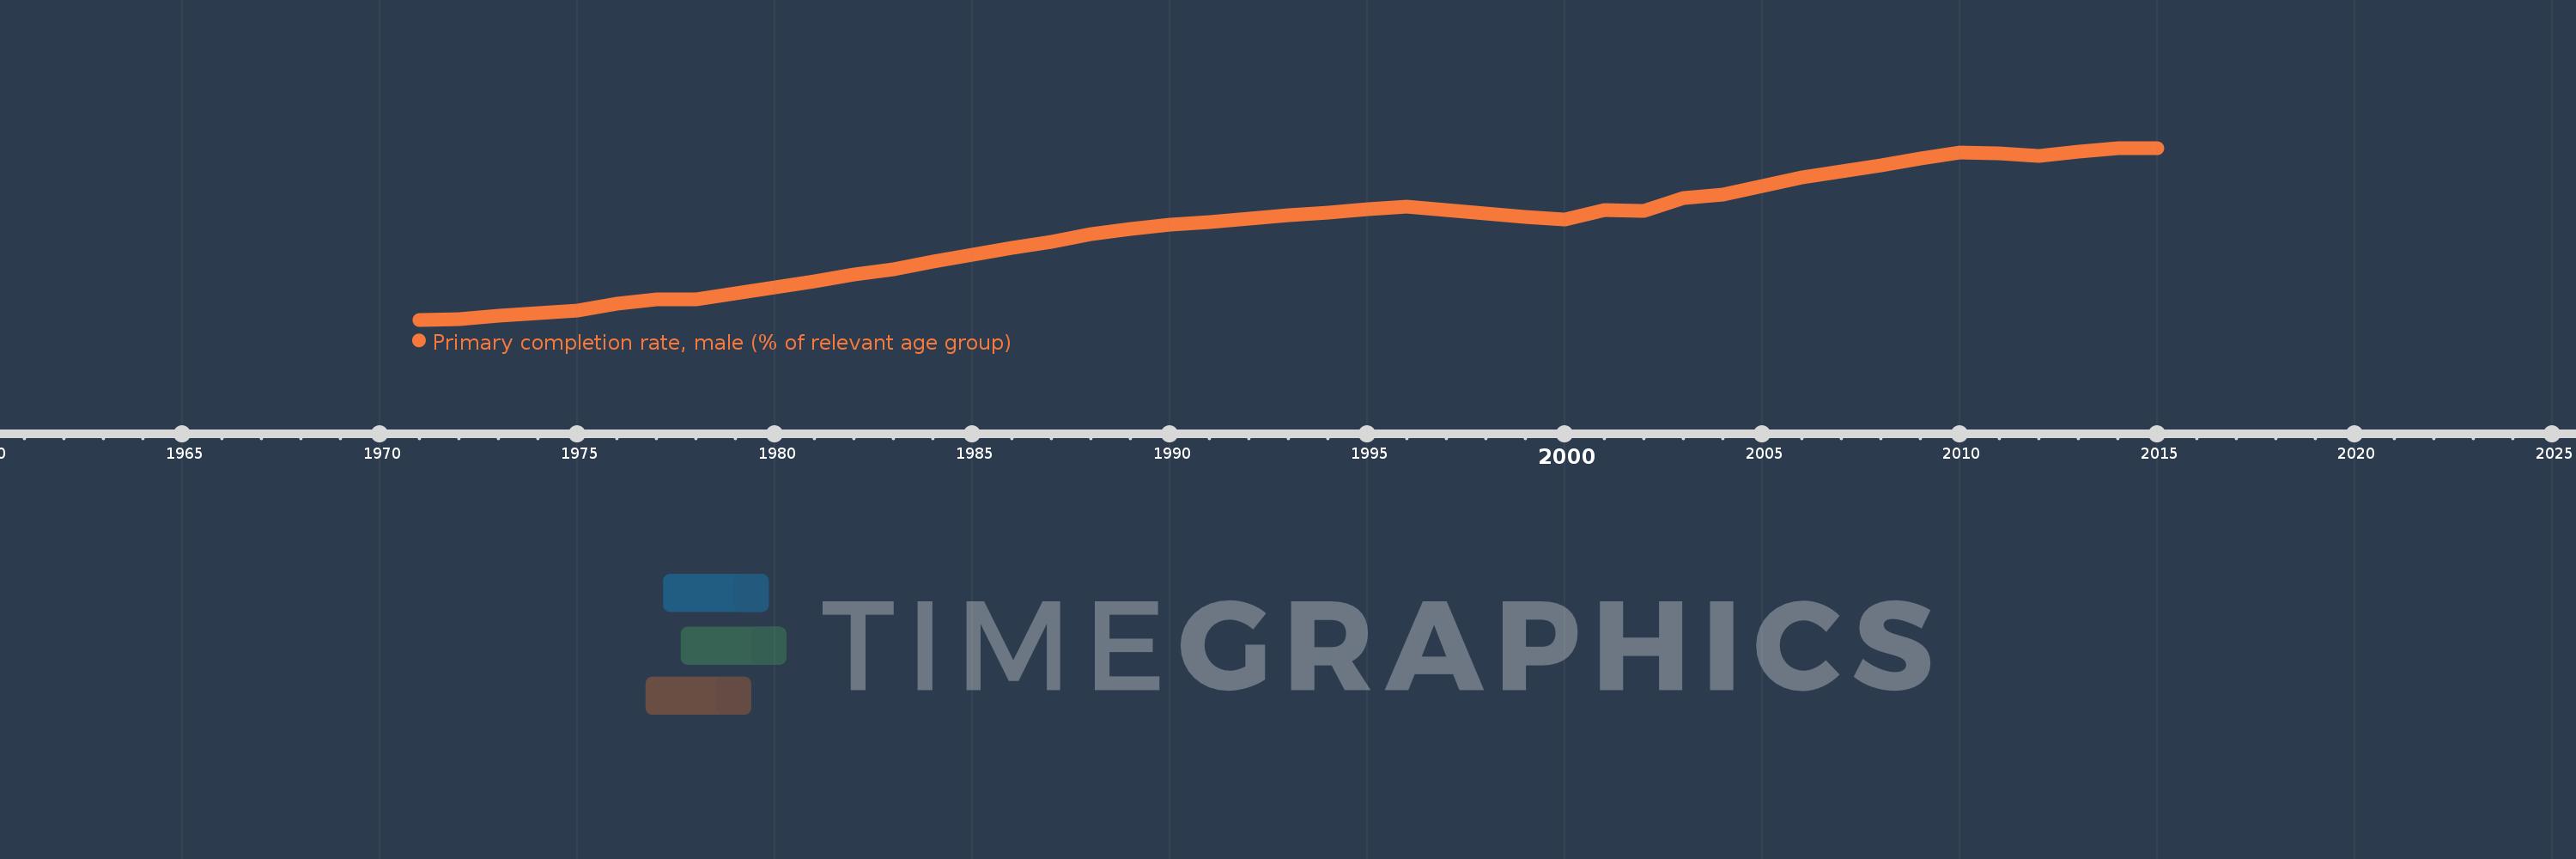
Primary completion rate, male (% of relevant age group)
2015,2014,2013,2012,2011,2010,2009,2008,2007,2006,2005,2004,2003,2002,2001,2000,1999,1998,1997,1996,1995,1994,1993,1992,1991,1990,1989,1988,1987,1986,1985,1984,1983,1982,1981,1980,1979,1978,1977,1976,1975,1974,1973,1972,1971
This statistics in other country:
AfghanistanAlbaniaAlgeriaAngolaAntigua and BarbudaArab WorldArgentinaArmeniaArubaAustriaAzerbaijanBahamas, TheBahrainBangladeshBarbadosBelarusBelgiumBelizeBeninBermudaBhutanBoliviaBosnia and HerzegovinaBotswanaBrunei DarussalamBulgariaBurkina FasoBurundiCabo VerdeCambodiaCameroonCanadaCaribbean small statesCentral African RepublicCentral Europe and the BalticsChadChileChinaColombiaComorosCongo, Dem. Rep.Congo, Rep.Costa RicaCote d'IvoireCroatiaCubaCyprusCzech RepublicDenmarkDjiboutiDominicaDominican RepublicEarly-demographic dividendEast Asia & PacificEast Asia & Pacific (excluding high income)East Asia & Pacific (IDA & IBRD countries)EcuadorEgypt, Arab Rep.El SalvadorEquatorial GuineaEritreaEstoniaEthiopiaEuro areaEurope & Central AsiaEurope & Central Asia (excluding high income)Europe & Central Asia (IDA & IBRD countries)European UnionFijiFinlandFragile and conflict affected situationsFranceGabonGambia, TheGeorgiaGermanyGhanaGreeceGrenadaGuatemalaGuineaGuinea-BissauGuyanaHaitiHeavily indebted poor countries (HIPC)High incomeHondurasHong Kong SAR, ChinaHungaryIBRD onlyIcelandIDA & IBRD totalIDA blendIDA onlyIDA totalIndiaIndonesiaIran, Islamic Rep.IraqIrelandIsraelItalyJamaicaJapanJordanKazakhstanKenyaKiribatiKorea, Dem. People’s Rep.Korea, Rep.KuwaitKyrgyz RepublicLao PDRLate-demographic dividendLatin America & Caribbean Latin America & Caribbean (excluding high income)Latin America & the Caribbean (IDA & IBRD countries)LatviaLeast developed countries: UN classificationLebanonLesothoLiberiaLibyaLiechtensteinLithuaniaLow & middle incomeLow incomeLower middle incomeLuxembourgMacao SAR, ChinaMacedonia, FYRMadagascarMalawiMaldivesMaliMaltaMarshall IslandsMauritaniaMauritiusMexicoMiddle East & North AfricaMiddle East & North Africa (excluding high income)Middle East & North Africa (IDA & IBRD countries)Middle incomeMoldovaMongoliaMontenegroMoroccoMozambiqueMyanmarNamibiaNauruNepalNetherlandsNew ZealandNicaraguaNigerNigeriaNorwayOECD membersOmanOther small statesPacific island small statesPakistanPalauPanamaPapua New GuineaParaguayPeruPhilippinesPolandPortugalPost-demographic dividendPre-demographic dividendQatarRomaniaRussian FederationRwandaSamoaSan MarinoSao Tome and PrincipeSaudi ArabiaSenegalSerbiaSeychellesSierra LeoneSlovak RepublicSloveniaSmall statesSolomon IslandsSouth AfricaSouth AsiaSouth Asia (IDA & IBRD)South SudanSpainSri LankaSt. Kitts and NevisSt. LuciaSt. Vincent and the GrenadinesSub-Saharan Africa Sub-Saharan Africa (excluding high income)Sub-Saharan Africa (IDA & IBRD countries)SudanSurinameSwazilandSwedenSwitzerlandSyrian Arab RepublicTajikistanTanzaniaThailandTimor-LesteTogoTongaTrinidad and TobagoTunisiaTurkeyTuvaluUgandaUkraineUnited Arab EmiratesUpper middle incomeUruguayUzbekistanVanuatuVenezuela, RBVietnamWest Bank and GazaWorldYemen, Rep.ZambiaZimbabwe Timeline:
This timeline shows a graph from 1971 to 2015 of South Asia. No data until 1970. Number of actual observations by date: 45.
Source name:
World Development Indicators
Source organization:
United Nations Educational, Scientific, and Cultural Organization (UNESCO) Institute for Statistics.
Categories, topics:
Education, Gender
Last updated:
apr 23, 2017
Indicators value changes by year
Maximum:
90.278
jan 1, 2015
At the date of observation
Value
Absolute change
Change from previous value
jan 1, 1971
53.51
+53.51
0.0%
jan 1, 1972
53.676
+0.166
0.31%
jan 1, 1973
54.438
+0.762
1.42%
jan 1, 1974
54.982
+0.544
1.0%
jan 1, 1975
55.52
+0.538
0.98%
jan 1, 1976
56.883
+1.363
2.45%
jan 1, 1977
57.801
+0.918
1.61%
jan 1, 1978
57.776
-0.025
-0.04%
jan 1, 1979
59.092
+1.316
2.28%
jan 1, 1980
60.443
+1.351
2.29%
jan 1, 1981
61.796
+1.353
2.24%
jan 1, 1982
63.146
+1.35
2.18%
jan 1, 1983
64.371
+1.225
1.94%
jan 1, 1984
65.867
+1.496
2.32%
jan 1, 1985
67.372
+1.505
2.28%
jan 1, 1986
68.855
+1.483
2.2%
jan 1, 1987
70.271
+1.416
2.06%
jan 1, 1988
71.753
+1.482
2.11%
jan 1, 1989
72.949
+1.196
1.67%
jan 1, 1990
73.785
+0.836
1.15%
jan 1, 1991
74.482
+0.697
0.95%
jan 1, 1992
75.184
+0.701
0.94%
jan 1, 1993
75.893
+0.709
0.94%
jan 1, 1994
76.472
+0.579
0.76%
jan 1, 1995
77.08
+0.608
0.79%
jan 1, 1996
77.672
+0.593
0.77%
jan 1, 1997
76.947
-0.725
-0.93%
jan 1, 1998
76.235
-0.712
-0.93%
jan 1, 1999
75.535
-0.7
-0.92%
jan 1, 2000
74.883
-0.652
-0.86%
jan 1, 2001
77.043
+2.16
2.88%
jan 1, 2002
76.773
-0.27
-0.35%
jan 1, 2003
79.487
+2.714
3.54%
jan 1, 2004
80.228
+0.741
0.93%
jan 1, 2005
82.136
+1.908
2.38%
jan 1, 2006
84.052
+1.915
2.33%
jan 1, 2007
85.318
+1.267
1.51%
jan 1, 2008
86.636
+1.318
1.54%
jan 1, 2009
88.046
+1.41
1.63%
jan 1, 2010
89.269
+1.223
1.39%
jan 1, 2011
89.038
-0.231
-0.26%
jan 1, 2012
88.628
-0.41
-0.46%
jan 1, 2013
89.548
+0.92
1.04%
jan 1, 2014
90.133
+0.585
0.65%
jan 1, 2015
90.278
+0.145
0.16%
Ranking of countries by current statistics by years


Comments: