29
/
en
AIzaSyAYiBZKx7MnpbEhh9jyipgxe19OcubqV5w
April 1, 2024
257713
Switzerland
CHE
true
2
1
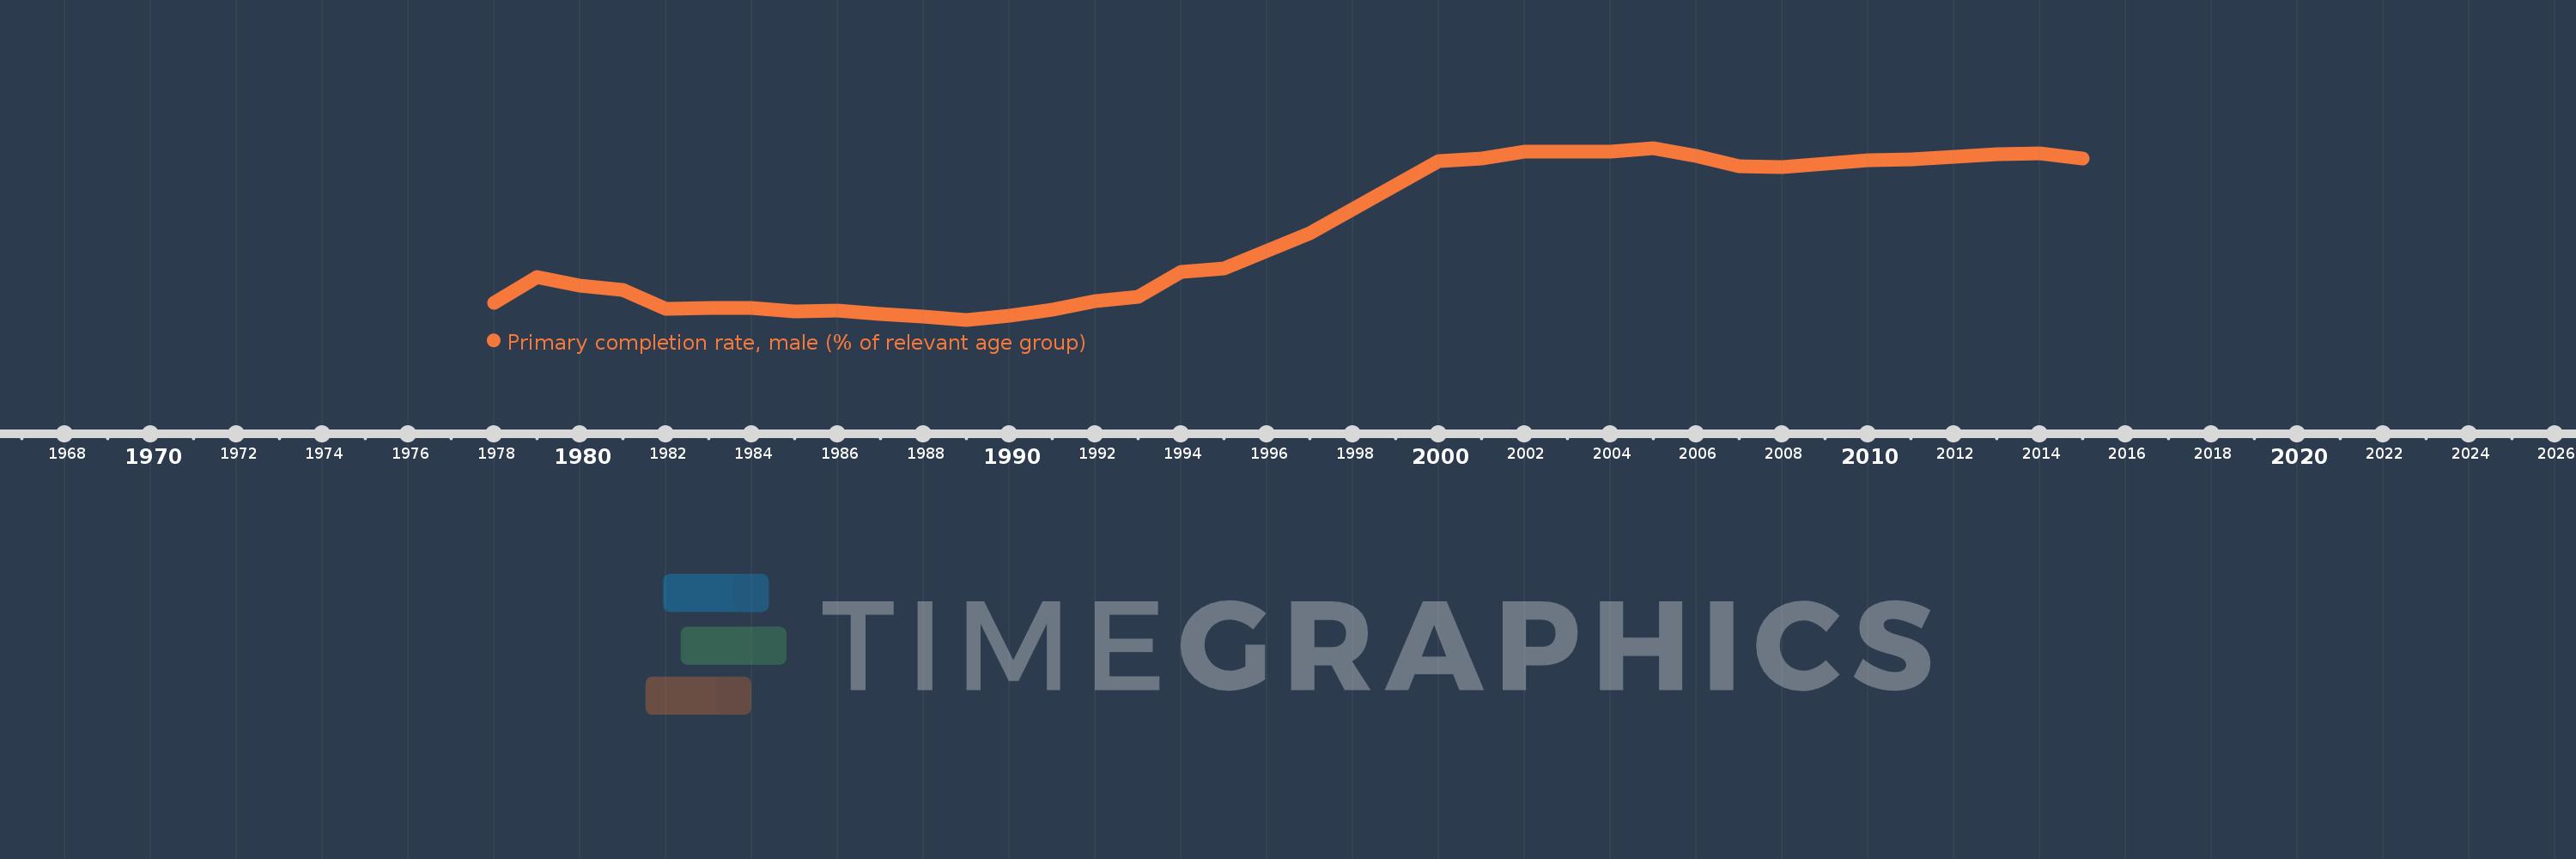
Primary completion rate, male (% of relevant age group)
2015,2014,2013,2012,2011,2010,2009,2008,2007,2006,2005,2004,2003,2002,2001,2000,1997,1995,1994,1993,1992,1991,1990,1989,1988,1987,1986,1985,1984,1983,1982,1981,1980,1979,1978
This statistics in other country:
AfghanistanAlbaniaAlgeriaAngolaAntigua and BarbudaArab WorldArgentinaArmeniaArubaAustriaAzerbaijanBahamas, TheBahrainBangladeshBarbadosBelarusBelgiumBelizeBeninBermudaBhutanBoliviaBosnia and HerzegovinaBotswanaBrunei DarussalamBulgariaBurkina FasoBurundiCabo VerdeCambodiaCameroonCanadaCaribbean small statesCentral African RepublicCentral Europe and the BalticsChadChileChinaColombiaComorosCongo, Dem. Rep.Congo, Rep.Costa RicaCote d'IvoireCroatiaCubaCyprusCzech RepublicDenmarkDjiboutiDominicaDominican RepublicEarly-demographic dividendEast Asia & PacificEast Asia & Pacific (excluding high income)East Asia & Pacific (IDA & IBRD countries)EcuadorEgypt, Arab Rep.El SalvadorEquatorial GuineaEritreaEstoniaEthiopiaEuro areaEurope & Central AsiaEurope & Central Asia (excluding high income)Europe & Central Asia (IDA & IBRD countries)European UnionFijiFinlandFragile and conflict affected situationsFranceGabonGambia, TheGeorgiaGermanyGhanaGreeceGrenadaGuatemalaGuineaGuinea-BissauGuyanaHaitiHeavily indebted poor countries (HIPC)High incomeHondurasHong Kong SAR, ChinaHungaryIBRD onlyIcelandIDA & IBRD totalIDA blendIDA onlyIDA totalIndiaIndonesiaIran, Islamic Rep.IraqIrelandIsraelItalyJamaicaJapanJordanKazakhstanKenyaKiribatiKorea, Dem. People’s Rep.Korea, Rep.KuwaitKyrgyz RepublicLao PDRLate-demographic dividendLatin America & Caribbean Latin America & Caribbean (excluding high income)Latin America & the Caribbean (IDA & IBRD countries)LatviaLeast developed countries: UN classificationLebanonLesothoLiberiaLibyaLiechtensteinLithuaniaLow & middle incomeLow incomeLower middle incomeLuxembourgMacao SAR, ChinaMacedonia, FYRMadagascarMalawiMaldivesMaliMaltaMarshall IslandsMauritaniaMauritiusMexicoMiddle East & North AfricaMiddle East & North Africa (excluding high income)Middle East & North Africa (IDA & IBRD countries)Middle incomeMoldovaMongoliaMontenegroMoroccoMozambiqueMyanmarNamibiaNauruNepalNetherlandsNew ZealandNicaraguaNigerNigeriaNorwayOECD membersOmanOther small statesPacific island small statesPakistanPalauPanamaPapua New GuineaParaguayPeruPhilippinesPolandPortugalPost-demographic dividendPre-demographic dividendQatarRomaniaRussian FederationRwandaSamoaSan MarinoSao Tome and PrincipeSaudi ArabiaSenegalSerbiaSeychellesSierra LeoneSlovak RepublicSloveniaSmall statesSolomon IslandsSouth AfricaSouth AsiaSouth Asia (IDA & IBRD)South SudanSpainSri LankaSt. Kitts and NevisSt. LuciaSt. Vincent and the GrenadinesSub-Saharan Africa Sub-Saharan Africa (excluding high income)Sub-Saharan Africa (IDA & IBRD countries)SudanSurinameSwazilandSwedenSwitzerlandSyrian Arab RepublicTajikistanTanzaniaThailandTimor-LesteTogoTongaTrinidad and TobagoTunisiaTurkeyTuvaluUgandaUkraineUnited Arab EmiratesUpper middle incomeUruguayUzbekistanVanuatuVenezuela, RBVietnamWest Bank and GazaWorldYemen, Rep.ZambiaZimbabwe Timeline:
This timeline shows a graph from 1978 to 2015 of Switzerland. No data until 1977. Number of actual observations by date: 35.
Source name:
World Development Indicators
Source organization:
United Nations Educational, Scientific, and Cultural Organization (UNESCO) Institute for Statistics.
Categories, topics:
Education, Gender
Last updated:
apr 23, 2017
Indicators value changes by year
Minimum:
47.906
jan 1, 1989
Maximum:
97.696
jan 1, 2005
At the date of observation
Value
Absolute change
Change from previous value
jan 1, 1978
52.771
+52.771
0.0%
jan 1, 1979
60.188
+7.417
14.06%
jan 1, 1980
57.763
-2.425
-4.03%
jan 1, 1981
56.636
-1.127
-1.95%
jan 1, 1982
51.166
-5.47
-9.66%
jan 1, 1983
51.194
+0.028
0.05%
jan 1, 1984
51.414
+0.22
0.43%
jan 1, 1985
50.29
-1.124
-2.19%
jan 1, 1986
50.558
+0.267
0.53%
jan 1, 1987
49.465
-1.093
-2.16%
jan 1, 1988
48.763
-0.702
-1.42%
jan 1, 1989
47.906
-0.857
-1.76%
jan 1, 1990
49.093
+1.187
2.48%
jan 1, 1991
50.926
+1.833
3.73%
jan 1, 1992
53.357
+2.431
4.77%
jan 1, 1993
54.611
+1.254
2.35%
jan 1, 1994
61.826
+7.215
13.21%
jan 1, 1995
62.856
+1.03
1.67%
jan 1, 1997
72.897
+10.041
15.98%
jan 1, 2000
93.777
+20.88
28.64%
jan 1, 2001
94.691
+0.914
0.97%
jan 1, 2002
96.732
+2.04
2.15%
jan 1, 2003
96.649
-0.083
-0.09%
jan 1, 2004
96.596
-0.053
-0.05%
jan 1, 2005
97.696
+1.099
1.14%
jan 1, 2006
95.41
-2.286
-2.34%
jan 1, 2007
92.421
-2.989
-3.13%
jan 1, 2008
92.044
-0.378
-0.41%
jan 1, 2009
93.204
+1.16
1.26%
jan 1, 2010
94.242
+1.038
1.11%
jan 1, 2011
94.398
+0.156
0.17%
jan 1, 2012
95.248
+0.849
0.9%
jan 1, 2013
95.886
+0.638
0.67%
jan 1, 2014
96.112
+0.226
0.24%
jan 1, 2015
94.583
-1.528
-1.59%
Ranking of countries by current statistics by years


Comments: