29
/
en
AIzaSyAYiBZKx7MnpbEhh9jyipgxe19OcubqV5w
April 1, 2024
258888
Syrian Arab Republic
SYR
true
2
1
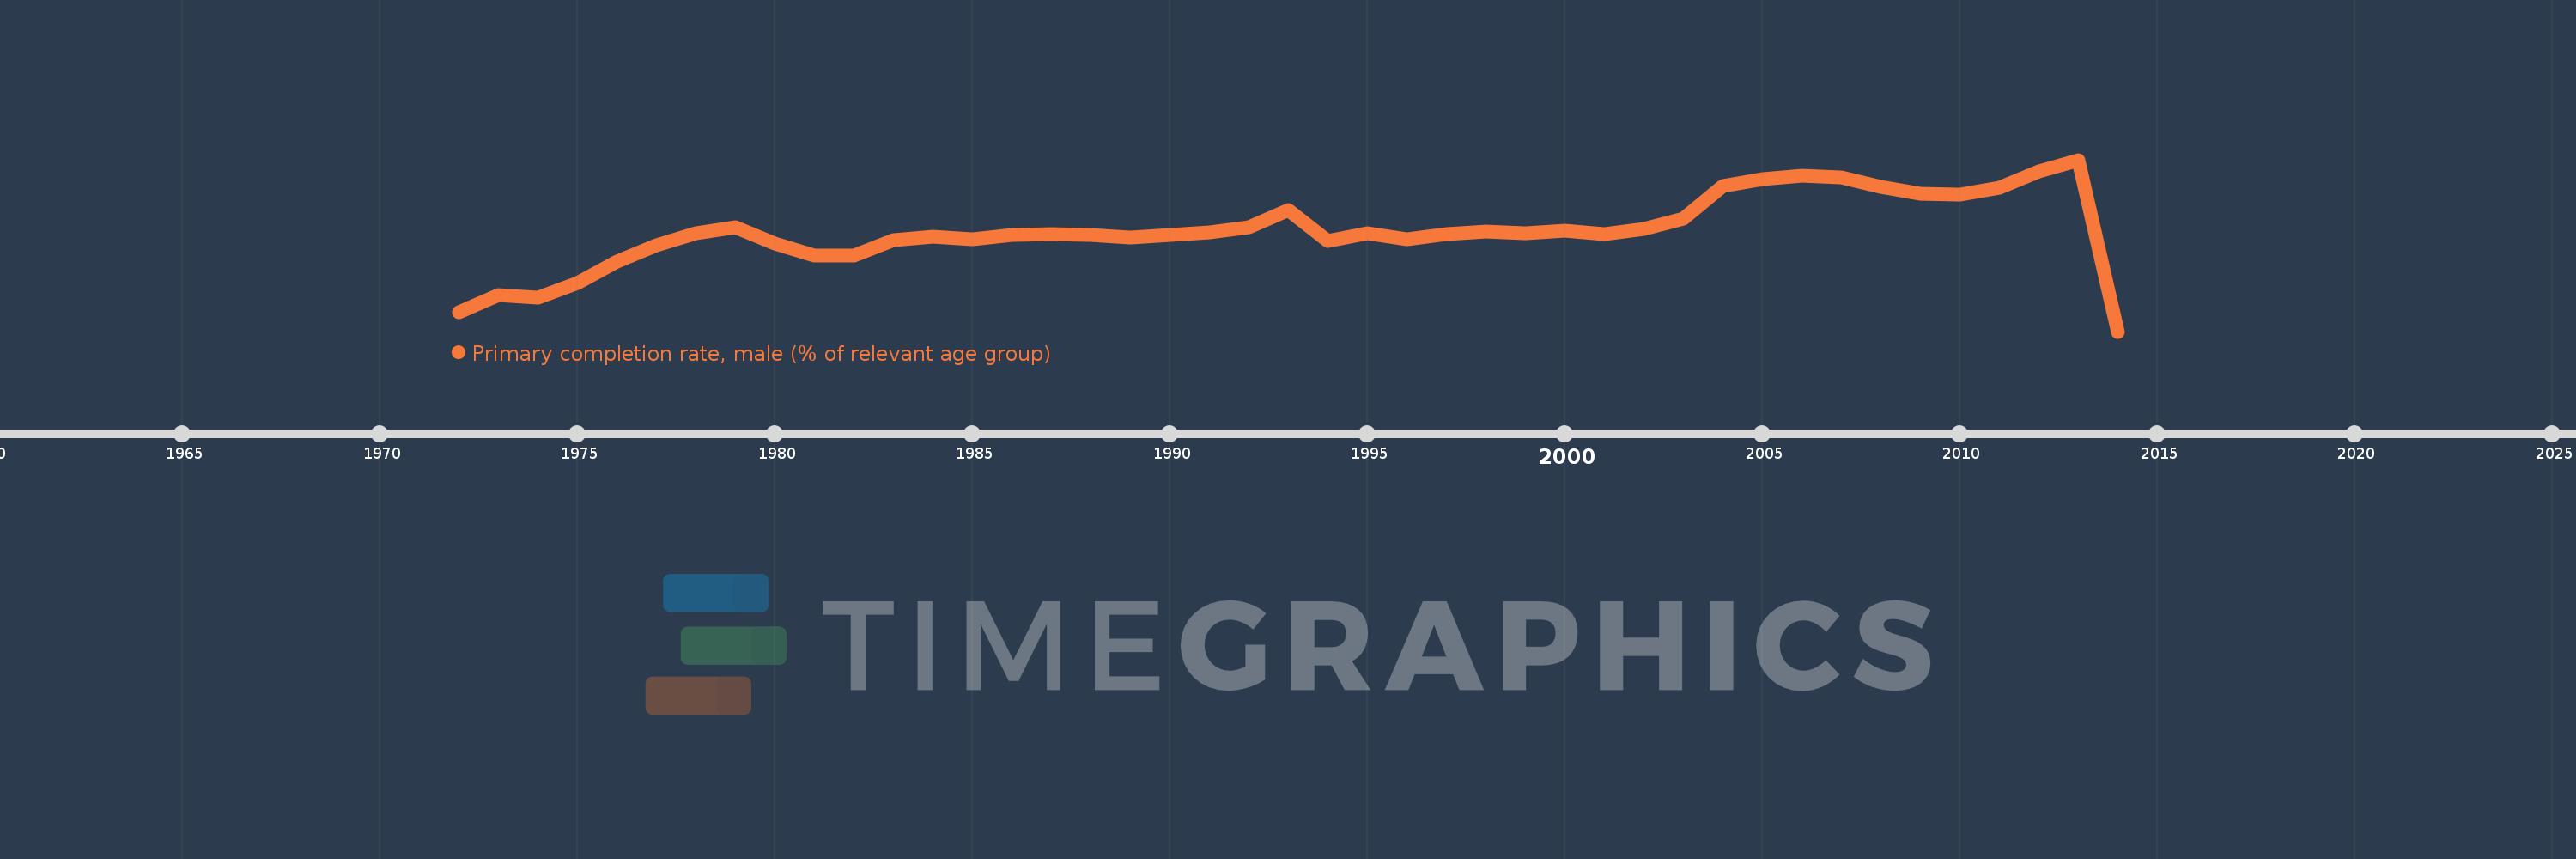
Primary completion rate, male (% of relevant age group)
2014,2013,2012,2011,2010,2009,2008,2007,2006,2005,2004,2003,2002,2001,2000,1999,1998,1997,1996,1995,1994,1993,1992,1991,1990,1989,1988,1987,1986,1985,1984,1983,1982,1981,1980,1979,1978,1977,1976,1975,1974,1973,1972
This statistics in other country:
AfghanistanAlbaniaAlgeriaAngolaAntigua and BarbudaArab WorldArgentinaArmeniaArubaAustriaAzerbaijanBahamas, TheBahrainBangladeshBarbadosBelarusBelgiumBelizeBeninBermudaBhutanBoliviaBosnia and HerzegovinaBotswanaBrunei DarussalamBulgariaBurkina FasoBurundiCabo VerdeCambodiaCameroonCanadaCaribbean small statesCentral African RepublicCentral Europe and the BalticsChadChileChinaColombiaComorosCongo, Dem. Rep.Congo, Rep.Costa RicaCote d'IvoireCroatiaCubaCyprusCzech RepublicDenmarkDjiboutiDominicaDominican RepublicEarly-demographic dividendEast Asia & PacificEast Asia & Pacific (excluding high income)East Asia & Pacific (IDA & IBRD countries)EcuadorEgypt, Arab Rep.El SalvadorEquatorial GuineaEritreaEstoniaEthiopiaEuro areaEurope & Central AsiaEurope & Central Asia (excluding high income)Europe & Central Asia (IDA & IBRD countries)European UnionFijiFinlandFragile and conflict affected situationsFranceGabonGambia, TheGeorgiaGermanyGhanaGreeceGrenadaGuatemalaGuineaGuinea-BissauGuyanaHaitiHeavily indebted poor countries (HIPC)High incomeHondurasHong Kong SAR, ChinaHungaryIBRD onlyIcelandIDA & IBRD totalIDA blendIDA onlyIDA totalIndiaIndonesiaIran, Islamic Rep.IraqIrelandIsraelItalyJamaicaJapanJordanKazakhstanKenyaKiribatiKorea, Dem. People’s Rep.Korea, Rep.KuwaitKyrgyz RepublicLao PDRLate-demographic dividendLatin America & Caribbean Latin America & Caribbean (excluding high income)Latin America & the Caribbean (IDA & IBRD countries)LatviaLeast developed countries: UN classificationLebanonLesothoLiberiaLibyaLiechtensteinLithuaniaLow & middle incomeLow incomeLower middle incomeLuxembourgMacao SAR, ChinaMacedonia, FYRMadagascarMalawiMaldivesMaliMaltaMarshall IslandsMauritaniaMauritiusMexicoMiddle East & North AfricaMiddle East & North Africa (excluding high income)Middle East & North Africa (IDA & IBRD countries)Middle incomeMoldovaMongoliaMontenegroMoroccoMozambiqueMyanmarNamibiaNauruNepalNetherlandsNew ZealandNicaraguaNigerNigeriaNorwayOECD membersOmanOther small statesPacific island small statesPakistanPalauPanamaPapua New GuineaParaguayPeruPhilippinesPolandPortugalPost-demographic dividendPre-demographic dividendQatarRomaniaRussian FederationRwandaSamoaSan MarinoSao Tome and PrincipeSaudi ArabiaSenegalSerbiaSeychellesSierra LeoneSlovak RepublicSloveniaSmall statesSolomon IslandsSouth AfricaSouth AsiaSouth Asia (IDA & IBRD)South SudanSpainSri LankaSt. Kitts and NevisSt. LuciaSt. Vincent and the GrenadinesSub-Saharan Africa Sub-Saharan Africa (excluding high income)Sub-Saharan Africa (IDA & IBRD countries)SudanSurinameSwazilandSwedenSwitzerlandSyrian Arab RepublicTajikistanTanzaniaThailandTimor-LesteTogoTongaTrinidad and TobagoTunisiaTurkeyTuvaluUgandaUkraineUnited Arab EmiratesUpper middle incomeUruguayUzbekistanVanuatuVenezuela, RBVietnamWest Bank and GazaWorldYemen, Rep.ZambiaZimbabwe Timeline:
This timeline shows a graph from 1972 to 2014 of Syrian Arab Republic. No data until 1971. Number of actual observations by date: 43.
Source name:
World Development Indicators
Source organization:
United Nations Educational, Scientific, and Cultural Organization (UNESCO) Institute for Statistics.
Categories, topics:
Education, Gender
Last updated:
apr 23, 2017
Indicators value changes by year
Minimum:
69.252
jan 1, 2014
Maximum:
114.199
jan 1, 2013
At the date of observation
Value
Absolute change
Change from previous value
jan 1, 1972
74.413
+74.413
0.0%
jan 1, 1973
78.875
+4.462
6.0%
jan 1, 1974
78.084
-0.791
-1.0%
jan 1, 1975
81.939
+3.855
4.94%
jan 1, 1976
87.542
+5.603
6.84%
jan 1, 1977
91.765
+4.223
4.82%
jan 1, 1978
94.917
+3.152
3.44%
jan 1, 1979
96.549
+1.632
1.72%
jan 1, 1980
92.277
-4.272
-4.43%
jan 1, 1981
89.055
-3.221
-3.49%
jan 1, 1982
89.058
+0.002
0.0%
jan 1, 1983
93.201
+4.143
4.65%
jan 1, 1984
94.128
+0.927
0.99%
jan 1, 1985
93.309
-0.819
-0.87%
jan 1, 1986
94.515
+1.206
1.29%
jan 1, 1987
94.807
+0.292
0.31%
jan 1, 1988
94.597
-0.21
-0.22%
jan 1, 1989
93.894
-0.703
-0.74%
jan 1, 1990
94.569
+0.675
0.72%
jan 1, 1991
95.204
+0.635
0.67%
jan 1, 1992
96.569
+1.365
1.43%
jan 1, 1993
100.943
+4.374
4.53%
jan 1, 1994
92.948
-7.995
-7.92%
jan 1, 1995
94.973
+2.025
2.18%
jan 1, 1996
93.487
-1.487
-1.57%
jan 1, 1997
94.828
+1.341
1.43%
jan 1, 1998
95.38
+0.553
0.58%
jan 1, 1999
94.953
-0.427
-0.45%
jan 1, 2000
95.55
+0.596
0.63%
jan 1, 2001
94.779
-0.771
-0.81%
jan 1, 2002
96.186
+1.407
1.48%
jan 1, 2003
98.768
+2.582
2.68%
jan 1, 2004
107.362
+8.593
8.7%
jan 1, 2005
109.053
+1.692
1.58%
jan 1, 2006
110.111
+1.058
0.97%
jan 1, 2007
109.535
-0.577
-0.52%
jan 1, 2008
107.058
-2.477
-2.26%
jan 1, 2009
105.414
-1.644
-1.54%
jan 1, 2010
105.081
-0.333
-0.32%
jan 1, 2011
106.861
+1.78
1.69%
jan 1, 2012
111.082
+4.221
3.95%
jan 1, 2013
114.199
+3.116
2.81%
jan 1, 2014
69.252
-44.946
-39.36%
Ranking of countries by current statistics by years


Comments: