29
/
en
AIzaSyAYiBZKx7MnpbEhh9jyipgxe19OcubqV5w
April 1, 2024
168974
Kiribati
KIR
true
2
1
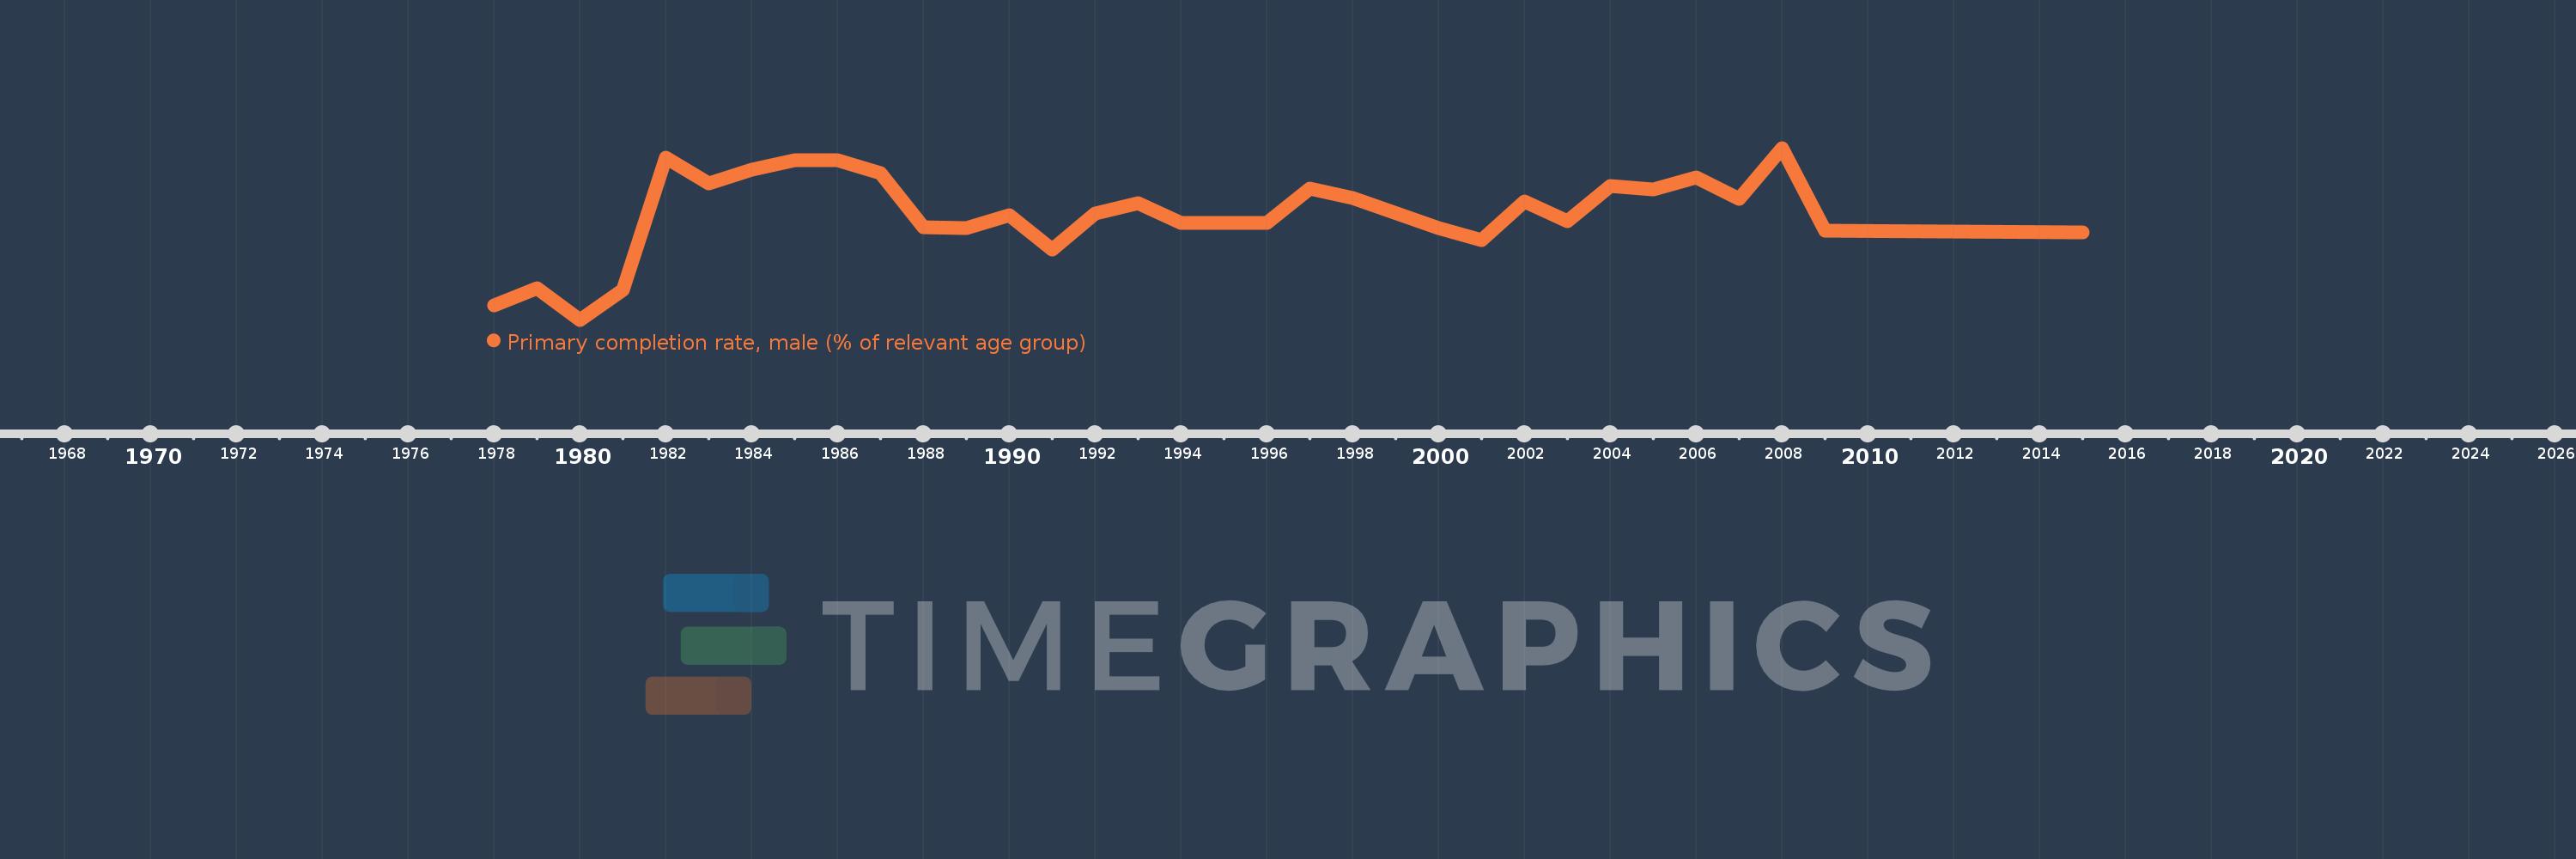
Primary completion rate, male (% of relevant age group)
2015,2009,2008,2007,2006,2005,2004,2003,2002,2001,2000,1998,1997,1996,1994,1993,1992,1991,1990,1989,1988,1987,1986,1985,1984,1983,1982,1981,1980,1979,1978
This statistics in other country:
AfghanistanAlbaniaAlgeriaAngolaAntigua and BarbudaArab WorldArgentinaArmeniaArubaAustriaAzerbaijanBahamas, TheBahrainBangladeshBarbadosBelarusBelgiumBelizeBeninBermudaBhutanBoliviaBosnia and HerzegovinaBotswanaBrunei DarussalamBulgariaBurkina FasoBurundiCabo VerdeCambodiaCameroonCanadaCaribbean small statesCentral African RepublicCentral Europe and the BalticsChadChileChinaColombiaComorosCongo, Dem. Rep.Congo, Rep.Costa RicaCote d'IvoireCroatiaCubaCyprusCzech RepublicDenmarkDjiboutiDominicaDominican RepublicEarly-demographic dividendEast Asia & PacificEast Asia & Pacific (excluding high income)East Asia & Pacific (IDA & IBRD countries)EcuadorEgypt, Arab Rep.El SalvadorEquatorial GuineaEritreaEstoniaEthiopiaEuro areaEurope & Central AsiaEurope & Central Asia (excluding high income)Europe & Central Asia (IDA & IBRD countries)European UnionFijiFinlandFragile and conflict affected situationsFranceGabonGambia, TheGeorgiaGermanyGhanaGreeceGrenadaGuatemalaGuineaGuinea-BissauGuyanaHaitiHeavily indebted poor countries (HIPC)High incomeHondurasHong Kong SAR, ChinaHungaryIBRD onlyIcelandIDA & IBRD totalIDA blendIDA onlyIDA totalIndiaIndonesiaIran, Islamic Rep.IraqIrelandIsraelItalyJamaicaJapanJordanKazakhstanKenyaKiribatiKorea, Dem. People’s Rep.Korea, Rep.KuwaitKyrgyz RepublicLao PDRLate-demographic dividendLatin America & Caribbean Latin America & Caribbean (excluding high income)Latin America & the Caribbean (IDA & IBRD countries)LatviaLeast developed countries: UN classificationLebanonLesothoLiberiaLibyaLiechtensteinLithuaniaLow & middle incomeLow incomeLower middle incomeLuxembourgMacao SAR, ChinaMacedonia, FYRMadagascarMalawiMaldivesMaliMaltaMarshall IslandsMauritaniaMauritiusMexicoMiddle East & North AfricaMiddle East & North Africa (excluding high income)Middle East & North Africa (IDA & IBRD countries)Middle incomeMoldovaMongoliaMontenegroMoroccoMozambiqueMyanmarNamibiaNauruNepalNetherlandsNew ZealandNicaraguaNigerNigeriaNorwayOECD membersOmanOther small statesPacific island small statesPakistanPalauPanamaPapua New GuineaParaguayPeruPhilippinesPolandPortugalPost-demographic dividendPre-demographic dividendQatarRomaniaRussian FederationRwandaSamoaSan MarinoSao Tome and PrincipeSaudi ArabiaSenegalSerbiaSeychellesSierra LeoneSlovak RepublicSloveniaSmall statesSolomon IslandsSouth AfricaSouth AsiaSouth Asia (IDA & IBRD)South SudanSpainSri LankaSt. Kitts and NevisSt. LuciaSt. Vincent and the GrenadinesSub-Saharan Africa Sub-Saharan Africa (excluding high income)Sub-Saharan Africa (IDA & IBRD countries)SudanSurinameSwazilandSwedenSwitzerlandSyrian Arab RepublicTajikistanTanzaniaThailandTimor-LesteTogoTongaTrinidad and TobagoTunisiaTurkeyTuvaluUgandaUkraineUnited Arab EmiratesUpper middle incomeUruguayUzbekistanVanuatuVenezuela, RBVietnamWest Bank and GazaWorldYemen, Rep.ZambiaZimbabwe Timeline:
This timeline shows a graph from 1978 to 2015 of Kiribati. No data until 1977. Number of actual observations by date: 31.
Source name:
World Development Indicators
Source organization:
United Nations Educational, Scientific, and Cultural Organization (UNESCO) Institute for Statistics.
Categories, topics:
Education, Gender
Last updated:
apr 23, 2017
Indicators value changes by year
Minimum:
74.409
jan 1, 1980
Maximum:
135.423
jan 1, 2008
At the date of observation
Value
Absolute change
Change from previous value
jan 1, 1978
79.427
+79.427
0.0%
jan 1, 1979
85.545
+6.118
7.7%
jan 1, 1980
74.409
-11.136
-13.02%
jan 1, 1981
84.888
+10.479
14.08%
jan 1, 1982
131.867
+46.978
55.34%
jan 1, 1983
122.877
-8.99
-6.82%
jan 1, 1984
127.786
+4.909
3.99%
jan 1, 1985
130.984
+3.198
2.5%
jan 1, 1986
131.071
+0.087
0.07%
jan 1, 1987
126.37
-4.701
-3.59%
jan 1, 1988
107.163
-19.207
-15.2%
jan 1, 1989
106.809
-0.354
-0.33%
jan 1, 1990
111.534
+4.725
4.42%
jan 1, 1991
99.274
-12.26
-10.99%
jan 1, 1992
112.085
+12.812
12.91%
jan 1, 1993
115.814
+3.729
3.33%
jan 1, 1994
108.844
-6.97
-6.02%
jan 1, 1996
108.645
-0.199
-0.18%
jan 1, 1997
121.014
+12.37
11.39%
jan 1, 1998
117.5
-3.514
-2.9%
jan 1, 2000
106.922
-10.578
-9.0%
jan 1, 2001
102.686
-4.236
-3.96%
jan 1, 2002
116.386
+13.7
13.34%
jan 1, 2003
109.372
-7.014
-6.03%
jan 1, 2004
121.825
+12.452
11.39%
jan 1, 2005
120.724
-1.101
-0.9%
jan 1, 2006
124.888
+4.165
3.45%
jan 1, 2007
117.468
-7.42
-5.94%
jan 1, 2008
135.423
+17.955
15.29%
jan 1, 2009
106.181
-29.243
-21.59%
jan 1, 2015
105.545
-0.635
-0.6%
Ranking of countries by current statistics by years


Comments: