29
/
en
AIzaSyAYiBZKx7MnpbEhh9jyipgxe19OcubqV5w
April 1, 2024
51408
Middle income
MIC
false
2
1
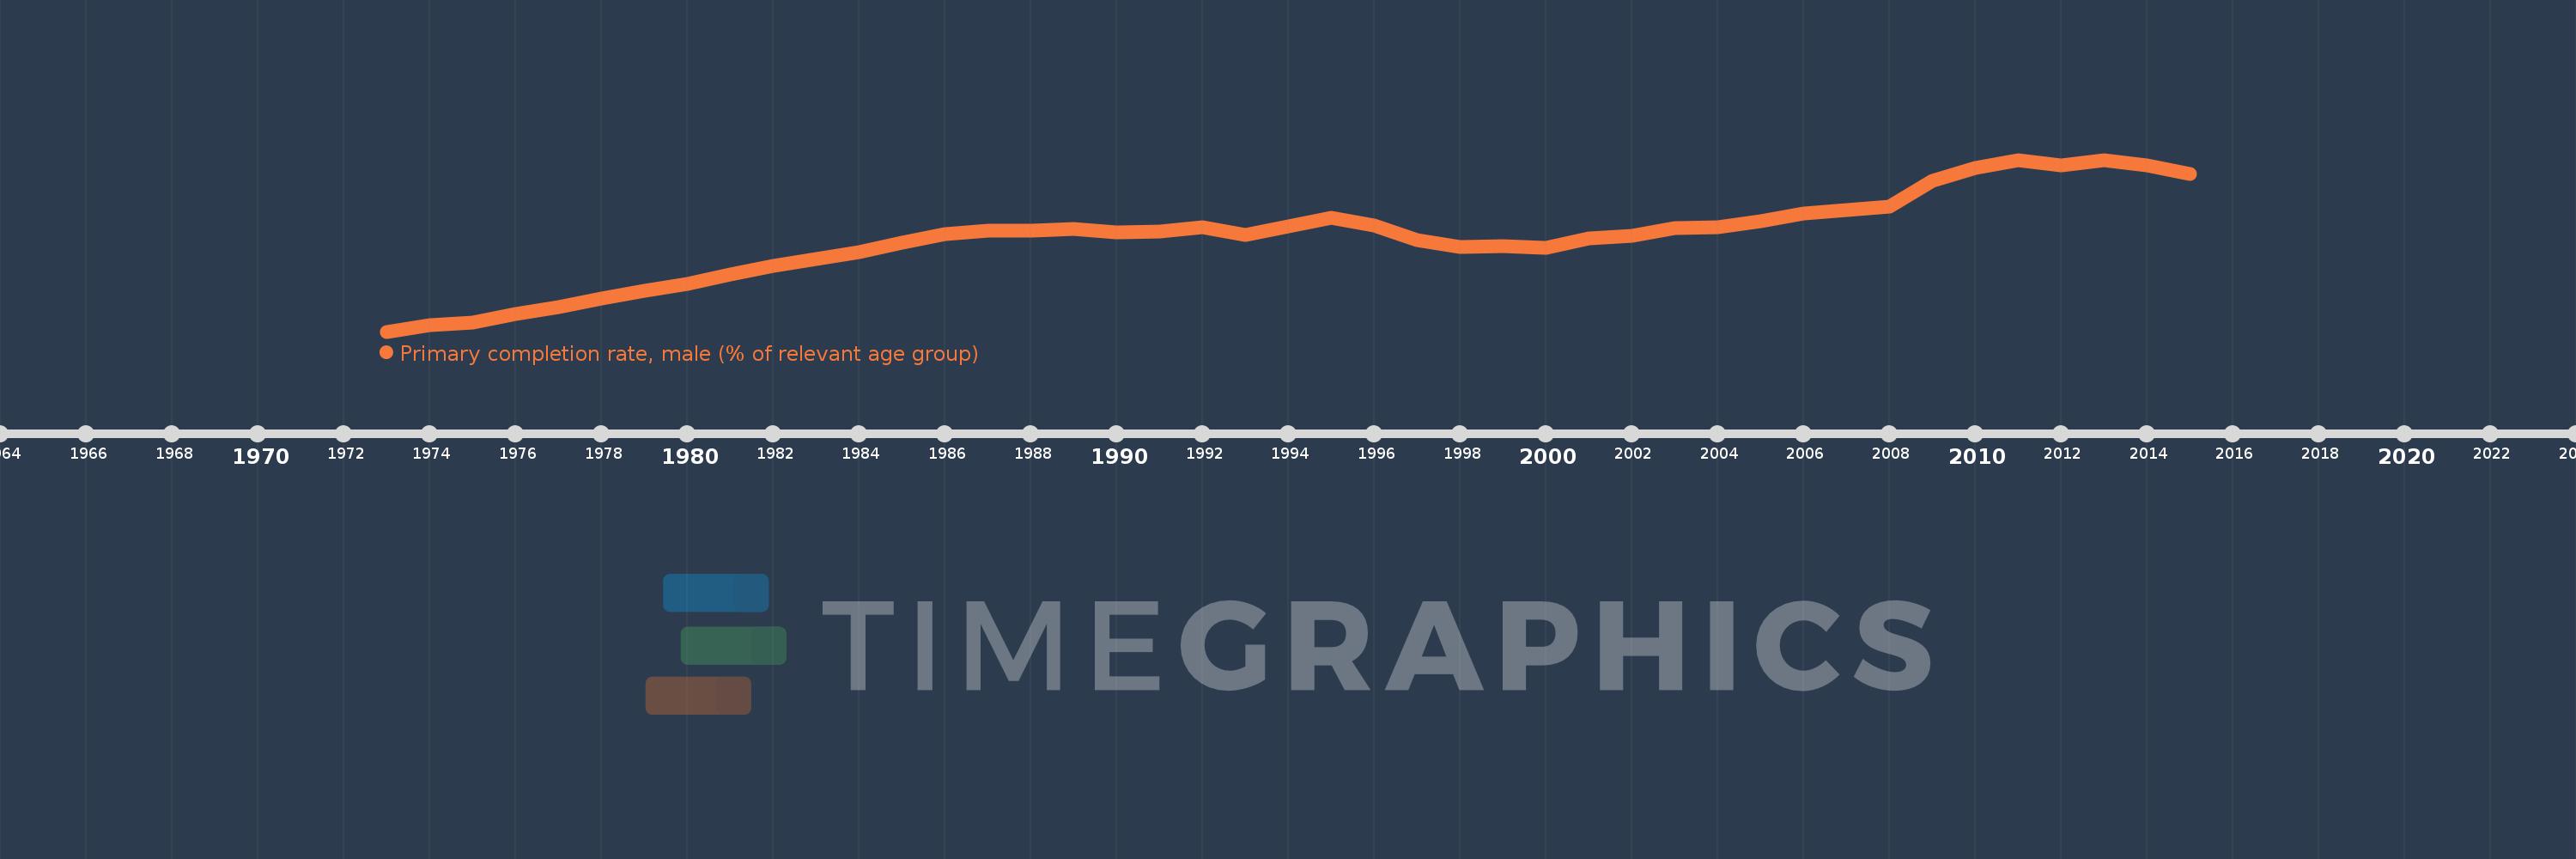
Primary completion rate, male (% of relevant age group)
2015,2014,2013,2012,2011,2010,2009,2008,2007,2006,2005,2004,2003,2002,2001,2000,1999,1998,1997,1996,1995,1994,1993,1992,1991,1990,1989,1988,1987,1986,1985,1984,1983,1982,1981,1980,1979,1978,1977,1976,1975,1974,1973
This statistics in other country:
AfghanistanAlbaniaAlgeriaAngolaAntigua and BarbudaArab WorldArgentinaArmeniaArubaAustriaAzerbaijanBahamas, TheBahrainBangladeshBarbadosBelarusBelgiumBelizeBeninBermudaBhutanBoliviaBosnia and HerzegovinaBotswanaBrunei DarussalamBulgariaBurkina FasoBurundiCabo VerdeCambodiaCameroonCanadaCaribbean small statesCentral African RepublicCentral Europe and the BalticsChadChileChinaColombiaComorosCongo, Dem. Rep.Congo, Rep.Costa RicaCote d'IvoireCroatiaCubaCyprusCzech RepublicDenmarkDjiboutiDominicaDominican RepublicEarly-demographic dividendEast Asia & PacificEast Asia & Pacific (excluding high income)East Asia & Pacific (IDA & IBRD countries)EcuadorEgypt, Arab Rep.El SalvadorEquatorial GuineaEritreaEstoniaEthiopiaEuro areaEurope & Central AsiaEurope & Central Asia (excluding high income)Europe & Central Asia (IDA & IBRD countries)European UnionFijiFinlandFragile and conflict affected situationsFranceGabonGambia, TheGeorgiaGermanyGhanaGreeceGrenadaGuatemalaGuineaGuinea-BissauGuyanaHaitiHeavily indebted poor countries (HIPC)High incomeHondurasHong Kong SAR, ChinaHungaryIBRD onlyIcelandIDA & IBRD totalIDA blendIDA onlyIDA totalIndiaIndonesiaIran, Islamic Rep.IraqIrelandIsraelItalyJamaicaJapanJordanKazakhstanKenyaKiribatiKorea, Dem. People’s Rep.Korea, Rep.KuwaitKyrgyz RepublicLao PDRLate-demographic dividendLatin America & Caribbean Latin America & Caribbean (excluding high income)Latin America & the Caribbean (IDA & IBRD countries)LatviaLeast developed countries: UN classificationLebanonLesothoLiberiaLibyaLiechtensteinLithuaniaLow & middle incomeLow incomeLower middle incomeLuxembourgMacao SAR, ChinaMacedonia, FYRMadagascarMalawiMaldivesMaliMaltaMarshall IslandsMauritaniaMauritiusMexicoMiddle East & North AfricaMiddle East & North Africa (excluding high income)Middle East & North Africa (IDA & IBRD countries)Middle incomeMoldovaMongoliaMontenegroMoroccoMozambiqueMyanmarNamibiaNauruNepalNetherlandsNew ZealandNicaraguaNigerNigeriaNorwayOECD membersOmanOther small statesPacific island small statesPakistanPalauPanamaPapua New GuineaParaguayPeruPhilippinesPolandPortugalPost-demographic dividendPre-demographic dividendQatarRomaniaRussian FederationRwandaSamoaSan MarinoSao Tome and PrincipeSaudi ArabiaSenegalSerbiaSeychellesSierra LeoneSlovak RepublicSloveniaSmall statesSolomon IslandsSouth AfricaSouth AsiaSouth Asia (IDA & IBRD)South SudanSpainSri LankaSt. Kitts and NevisSt. LuciaSt. Vincent and the GrenadinesSub-Saharan Africa Sub-Saharan Africa (excluding high income)Sub-Saharan Africa (IDA & IBRD countries)SudanSurinameSwazilandSwedenSwitzerlandSyrian Arab RepublicTajikistanTanzaniaThailandTimor-LesteTogoTongaTrinidad and TobagoTunisiaTurkeyTuvaluUgandaUkraineUnited Arab EmiratesUpper middle incomeUruguayUzbekistanVanuatuVenezuela, RBVietnamWest Bank and GazaWorldYemen, Rep.ZambiaZimbabwe Timeline:
This timeline shows a graph from 1973 to 2015 of Middle income. No data until 1972. Number of actual observations by date: 43.
Source name:
World Development Indicators
Source organization:
United Nations Educational, Scientific, and Cultural Organization (UNESCO) Institute for Statistics.
Categories, topics:
Education, Gender
Last updated:
apr 23, 2017
Indicators value changes by year
Minimum:
78.161
jan 1, 1973
Maximum:
94.467
jan 1, 2011
At the date of observation
Value
Absolute change
Change from previous value
jan 1, 1973
78.161
+78.161
0.0%
jan 1, 1974
78.813
+0.652
0.83%
jan 1, 1975
79.056
+0.243
0.31%
jan 1, 1976
79.804
+0.748
0.95%
jan 1, 1977
80.511
+0.706
0.89%
jan 1, 1978
81.326
+0.815
1.01%
jan 1, 1979
82.044
+0.718
0.88%
jan 1, 1980
82.721
+0.677
0.82%
jan 1, 1981
83.617
+0.896
1.08%
jan 1, 1982
84.437
+0.82
0.98%
jan 1, 1983
85.041
+0.604
0.72%
jan 1, 1984
85.676
+0.634
0.75%
jan 1, 1985
86.64
+0.964
1.13%
jan 1, 1986
87.455
+0.815
0.94%
jan 1, 1987
87.726
+0.271
0.31%
jan 1, 1988
87.705
-0.021
-0.02%
jan 1, 1989
87.894
+0.189
0.22%
jan 1, 1990
87.587
-0.307
-0.35%
jan 1, 1991
87.677
+0.09
0.1%
jan 1, 1992
88.041
+0.364
0.42%
jan 1, 1993
87.341
-0.7
-0.8%
jan 1, 1994
88.177
+0.836
0.96%
jan 1, 1995
88.999
+0.822
0.93%
jan 1, 1996
88.219
-0.78
-0.88%
jan 1, 1997
86.827
-1.392
-1.58%
jan 1, 1998
86.195
-0.632
-0.73%
jan 1, 1999
86.258
+0.063
0.07%
jan 1, 2000
86.126
-0.132
-0.15%
jan 1, 2001
86.988
+0.863
1.0%
jan 1, 2002
87.243
+0.254
0.29%
jan 1, 2003
88.002
+0.759
0.87%
jan 1, 2004
88.1
+0.098
0.11%
jan 1, 2005
88.628
+0.528
0.6%
jan 1, 2006
89.384
+0.757
0.85%
jan 1, 2007
89.693
+0.309
0.35%
jan 1, 2008
89.999
+0.306
0.34%
jan 1, 2009
92.431
+2.432
2.7%
jan 1, 2010
93.716
+1.285
1.39%
jan 1, 2011
94.467
+0.751
0.8%
jan 1, 2012
93.961
-0.507
-0.54%
jan 1, 2013
94.417
+0.456
0.49%
jan 1, 2014
93.954
-0.463
-0.49%
jan 1, 2015
93.146
-0.807
-0.86%
Ranking of countries by current statistics by years


Comments: