29
/
en
AIzaSyAYiBZKx7MnpbEhh9jyipgxe19OcubqV5w
April 1, 2024
172138
Kuwait
KWT
true
2
1
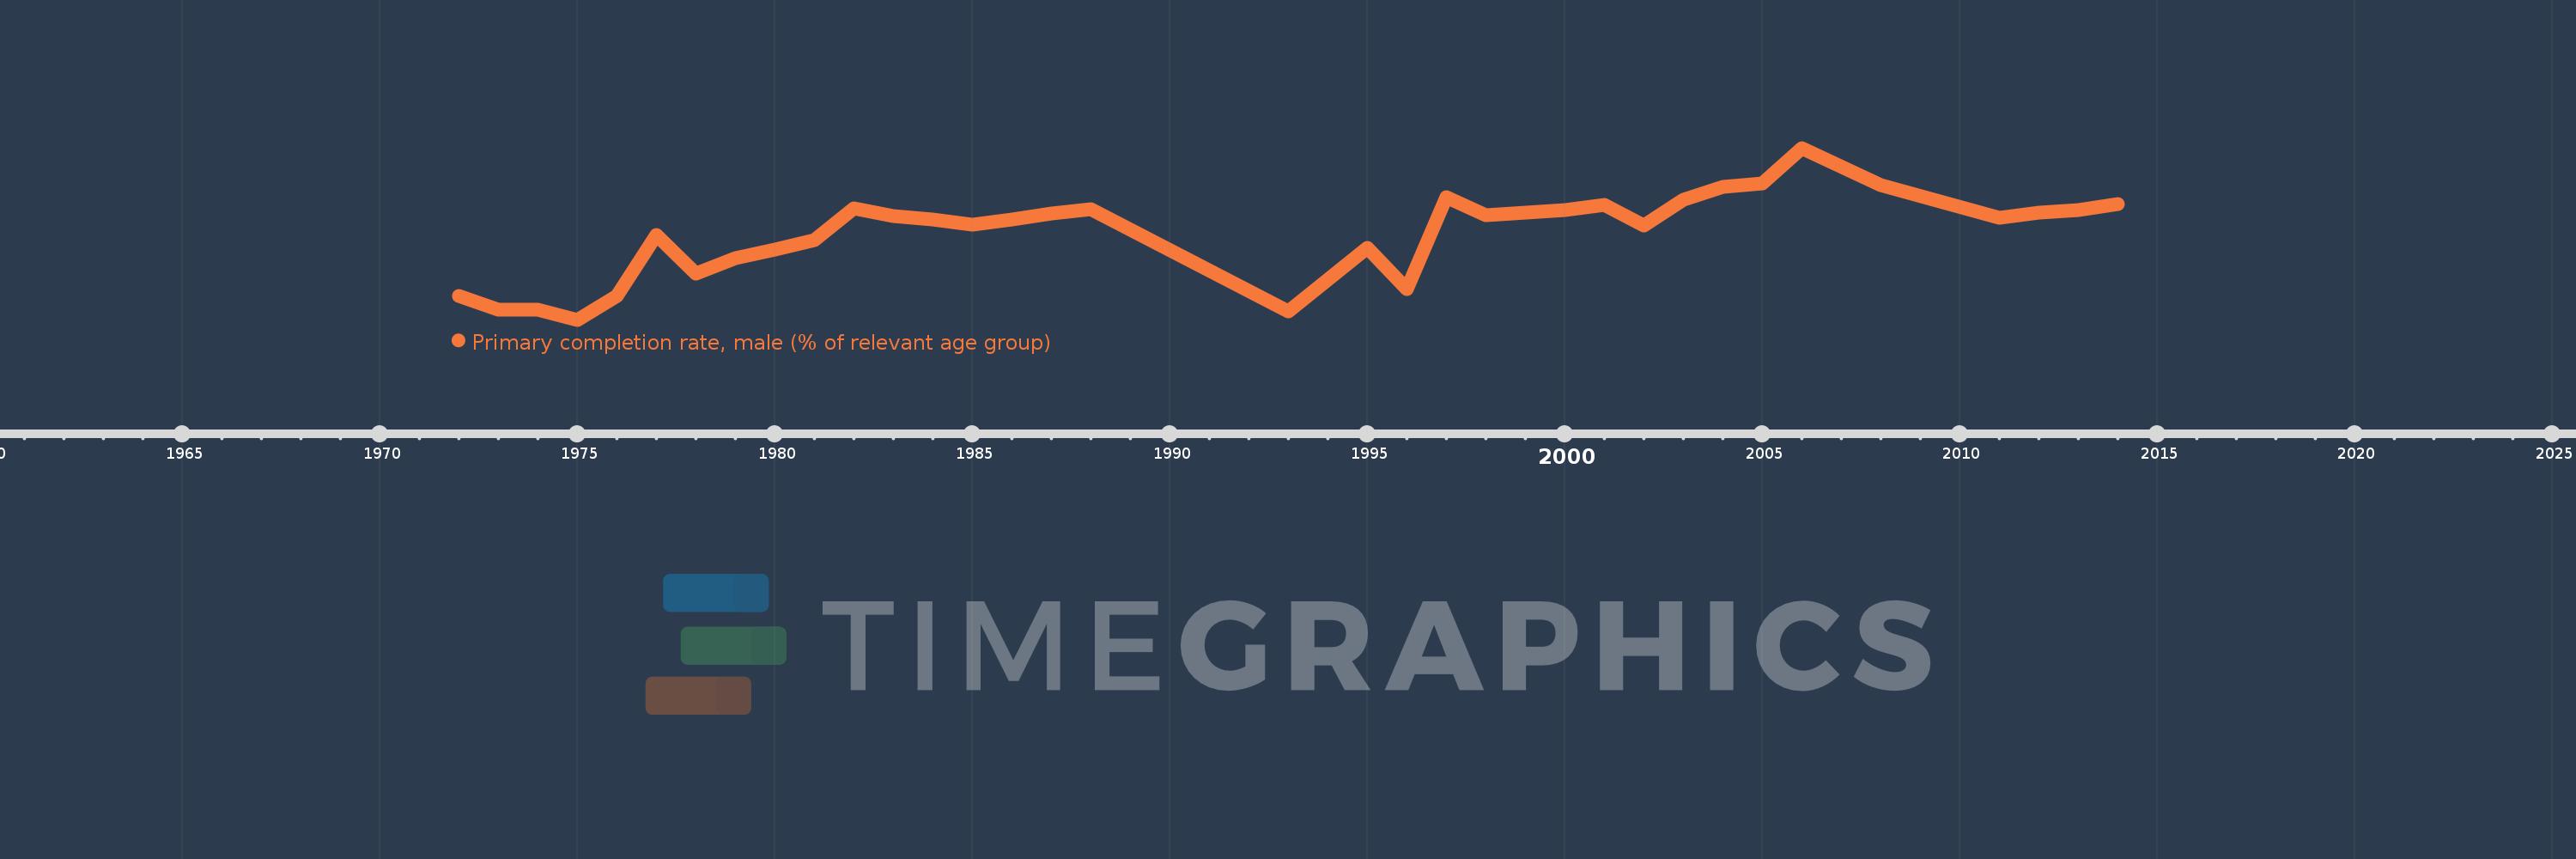
Primary completion rate, male (% of relevant age group)
2014,2013,2012,2011,2008,2006,2005,2004,2003,2002,2001,2000,1998,1997,1996,1995,1993,1988,1987,1986,1985,1984,1983,1982,1981,1980,1979,1978,1977,1976,1975,1974,1973,1972
This statistics in other country:
AfghanistanAlbaniaAlgeriaAngolaAntigua and BarbudaArab WorldArgentinaArmeniaArubaAustriaAzerbaijanBahamas, TheBahrainBangladeshBarbadosBelarusBelgiumBelizeBeninBermudaBhutanBoliviaBosnia and HerzegovinaBotswanaBrunei DarussalamBulgariaBurkina FasoBurundiCabo VerdeCambodiaCameroonCanadaCaribbean small statesCentral African RepublicCentral Europe and the BalticsChadChileChinaColombiaComorosCongo, Dem. Rep.Congo, Rep.Costa RicaCote d'IvoireCroatiaCubaCyprusCzech RepublicDenmarkDjiboutiDominicaDominican RepublicEarly-demographic dividendEast Asia & PacificEast Asia & Pacific (excluding high income)East Asia & Pacific (IDA & IBRD countries)EcuadorEgypt, Arab Rep.El SalvadorEquatorial GuineaEritreaEstoniaEthiopiaEuro areaEurope & Central AsiaEurope & Central Asia (excluding high income)Europe & Central Asia (IDA & IBRD countries)European UnionFijiFinlandFragile and conflict affected situationsFranceGabonGambia, TheGeorgiaGermanyGhanaGreeceGrenadaGuatemalaGuineaGuinea-BissauGuyanaHaitiHeavily indebted poor countries (HIPC)High incomeHondurasHong Kong SAR, ChinaHungaryIBRD onlyIcelandIDA & IBRD totalIDA blendIDA onlyIDA totalIndiaIndonesiaIran, Islamic Rep.IraqIrelandIsraelItalyJamaicaJapanJordanKazakhstanKenyaKiribatiKorea, Dem. People’s Rep.Korea, Rep.KuwaitKyrgyz RepublicLao PDRLate-demographic dividendLatin America & Caribbean Latin America & Caribbean (excluding high income)Latin America & the Caribbean (IDA & IBRD countries)LatviaLeast developed countries: UN classificationLebanonLesothoLiberiaLibyaLiechtensteinLithuaniaLow & middle incomeLow incomeLower middle incomeLuxembourgMacao SAR, ChinaMacedonia, FYRMadagascarMalawiMaldivesMaliMaltaMarshall IslandsMauritaniaMauritiusMexicoMiddle East & North AfricaMiddle East & North Africa (excluding high income)Middle East & North Africa (IDA & IBRD countries)Middle incomeMoldovaMongoliaMontenegroMoroccoMozambiqueMyanmarNamibiaNauruNepalNetherlandsNew ZealandNicaraguaNigerNigeriaNorwayOECD membersOmanOther small statesPacific island small statesPakistanPalauPanamaPapua New GuineaParaguayPeruPhilippinesPolandPortugalPost-demographic dividendPre-demographic dividendQatarRomaniaRussian FederationRwandaSamoaSan MarinoSao Tome and PrincipeSaudi ArabiaSenegalSerbiaSeychellesSierra LeoneSlovak RepublicSloveniaSmall statesSolomon IslandsSouth AfricaSouth AsiaSouth Asia (IDA & IBRD)South SudanSpainSri LankaSt. Kitts and NevisSt. LuciaSt. Vincent and the GrenadinesSub-Saharan Africa Sub-Saharan Africa (excluding high income)Sub-Saharan Africa (IDA & IBRD countries)SudanSurinameSwazilandSwedenSwitzerlandSyrian Arab RepublicTajikistanTanzaniaThailandTimor-LesteTogoTongaTrinidad and TobagoTunisiaTurkeyTuvaluUgandaUkraineUnited Arab EmiratesUpper middle incomeUruguayUzbekistanVanuatuVenezuela, RBVietnamWest Bank and GazaWorldYemen, Rep.ZambiaZimbabwe Timeline:
This timeline shows a graph from 1972 to 2014 of Kuwait. No data until 1971. Number of actual observations by date: 34.
Source name:
World Development Indicators
Source organization:
United Nations Educational, Scientific, and Cultural Organization (UNESCO) Institute for Statistics.
Categories, topics:
Education, Gender
Last updated:
apr 23, 2017
Indicators value changes by year
Minimum:
55.916
jan 1, 1975
Maximum:
120.675
jan 1, 2006
At the date of observation
Value
Absolute change
Change from previous value
jan 1, 1972
64.754
+64.754
0.0%
jan 1, 1973
59.659
-5.095
-7.87%
jan 1, 1974
59.748
+0.089
0.15%
jan 1, 1975
55.916
-3.833
-6.41%
jan 1, 1976
64.878
+8.962
16.03%
jan 1, 1977
87.781
+22.903
35.3%
jan 1, 1978
73.332
-14.449
-16.46%
jan 1, 1979
78.987
+5.655
7.71%
jan 1, 1980
82.254
+3.267
4.14%
jan 1, 1981
85.951
+3.697
4.49%
jan 1, 1982
97.821
+11.87
13.81%
jan 1, 1983
94.944
-2.877
-2.94%
jan 1, 1984
93.846
-1.098
-1.16%
jan 1, 1985
91.809
-2.037
-2.17%
jan 1, 1986
93.706
+1.897
2.07%
jan 1, 1987
95.929
+2.224
2.37%
jan 1, 1988
97.588
+1.659
1.73%
jan 1, 1993
59.013
-38.575
-39.53%
jan 1, 1995
83.02
+24.008
40.68%
jan 1, 1996
67.461
-15.559
-18.74%
jan 1, 1997
102.047
+34.586
51.27%
jan 1, 1998
95.227
-6.82
-6.68%
jan 1, 2000
97.352
+2.125
2.23%
jan 1, 2001
99.109
+1.757
1.8%
jan 1, 2002
91.308
-7.801
-7.87%
jan 1, 2003
101.291
+9.983
10.93%
jan 1, 2004
105.866
+4.575
4.52%
jan 1, 2005
107.462
+1.596
1.51%
jan 1, 2006
120.675
+13.213
12.3%
jan 1, 2008
106.656
-14.018
-11.62%
jan 1, 2011
94.294
-12.362
-11.59%
jan 1, 2012
96.379
+2.086
2.21%
jan 1, 2013
97.352
+0.973
1.01%
jan 1, 2014
99.613
+2.261
2.32%
Ranking of countries by current statistics by years


Comments: