29
/
en
AIzaSyAYiBZKx7MnpbEhh9jyipgxe19OcubqV5w
April 1, 2024
39926
IDA total
IDA
false
2
1
GNI (current US$)
2016,2015,2014,2013,2012,2011,2010,2009,2008,2007,2006,2005,2004,2003,2002,2001,2000,1999,1998,1997,1996,1995,1994,1993,1992,1991,1990,1989,1988,1987,1986,1985,1984,1983,1982,1981,1980,1979,1978,1977,1976,1975,1974
This statistics in other country:
AfghanistanAlbaniaAlgeriaAmerican SamoaAndorraAngolaAntigua and BarbudaArab WorldArgentinaArmeniaAustraliaAustriaAzerbaijanBahamas, TheBahrainBangladeshBarbadosBelarusBelgiumBelizeBeninBermudaBhutanBoliviaBosnia and HerzegovinaBotswanaBrazilBrunei DarussalamBulgariaBurkina FasoBurundiCabo VerdeCambodiaCameroonCanadaCaribbean small statesCentral African RepublicCentral Europe and the BalticsChadChannel IslandsChileChinaColombiaComorosCongo, Dem. Rep.Congo, Rep.Costa RicaCote d'IvoireCroatiaCubaCyprusCzech RepublicDenmarkDjiboutiDominicaDominican RepublicEarly-demographic dividendEast Asia & PacificEast Asia & Pacific (excluding high income)East Asia & Pacific (IDA & IBRD countries)EcuadorEgypt, Arab Rep.El SalvadorEquatorial GuineaEritreaEstoniaEthiopiaEuro areaEurope & Central AsiaEurope & Central Asia (excluding high income)Europe & Central Asia (IDA & IBRD countries)European UnionFaroe IslandsFijiFinlandFragile and conflict affected situationsFranceFrench PolynesiaGabonGambia, TheGeorgiaGermanyGhanaGreeceGreenlandGrenadaGuatemalaGuineaGuinea-BissauGuyanaHaitiHeavily indebted poor countries (HIPC)High incomeHondurasHong Kong SAR, ChinaHungaryIBRD onlyIcelandIDA & IBRD totalIDA blendIDA onlyIDA totalIndiaIndonesiaIran, Islamic Rep.IraqIrelandIsle of ManIsraelItalyJamaicaJapanJordanKazakhstanKenyaKiribatiKorea, Rep.KosovoKuwaitKyrgyz RepublicLao PDRLate-demographic dividendLatin America & Caribbean Latin America & Caribbean (excluding high income)Latin America & the Caribbean (IDA & IBRD countries)LatviaLeast developed countries: UN classificationLebanonLesothoLiberiaLibyaLiechtensteinLithuaniaLow & middle incomeLow incomeLower middle incomeLuxembourgMacao SAR, ChinaMacedonia, FYRMadagascarMalawiMalaysiaMaldivesMaliMaltaMarshall IslandsMauritaniaMauritiusMexicoMicronesia, Fed. Sts.Middle East & North AfricaMiddle East & North Africa (excluding high income)Middle East & North Africa (IDA & IBRD countries)Middle incomeMoldovaMonacoMongoliaMontenegroMoroccoMozambiqueMyanmarNamibiaNauruNepalNetherlandsNew CaledoniaNew ZealandNicaraguaNigerNigeriaNorth AmericaNorwayOECD membersOmanOther small statesPacific island small statesPakistanPalauPanamaPapua New GuineaParaguayPeruPhilippinesPolandPortugalPost-demographic dividendPre-demographic dividendPuerto RicoQatarRomaniaRussian FederationRwandaSamoaSan MarinoSao Tome and PrincipeSaudi ArabiaSenegalSerbiaSeychellesSierra LeoneSingaporeSlovak RepublicSloveniaSmall statesSolomon IslandsSomaliaSouth AfricaSouth AsiaSouth Asia (IDA & IBRD)South SudanSpainSri LankaSt. Kitts and NevisSt. LuciaSt. Vincent and the GrenadinesSub-Saharan Africa Sub-Saharan Africa (excluding high income)Sub-Saharan Africa (IDA & IBRD countries)SudanSurinameSwazilandSwedenSwitzerlandSyrian Arab RepublicTajikistanTanzaniaThailandTimor-LesteTogoTongaTrinidad and TobagoTunisiaTurkeyTurkmenistanTuvaluUgandaUkraineUnited Arab EmiratesUnited KingdomUnited StatesUpper middle incomeUruguayUzbekistanVanuatuVenezuela, RBVietnamVirgin Islands (U.S.)West Bank and GazaWorldYemen, Rep.ZambiaZimbabwe Timeline:
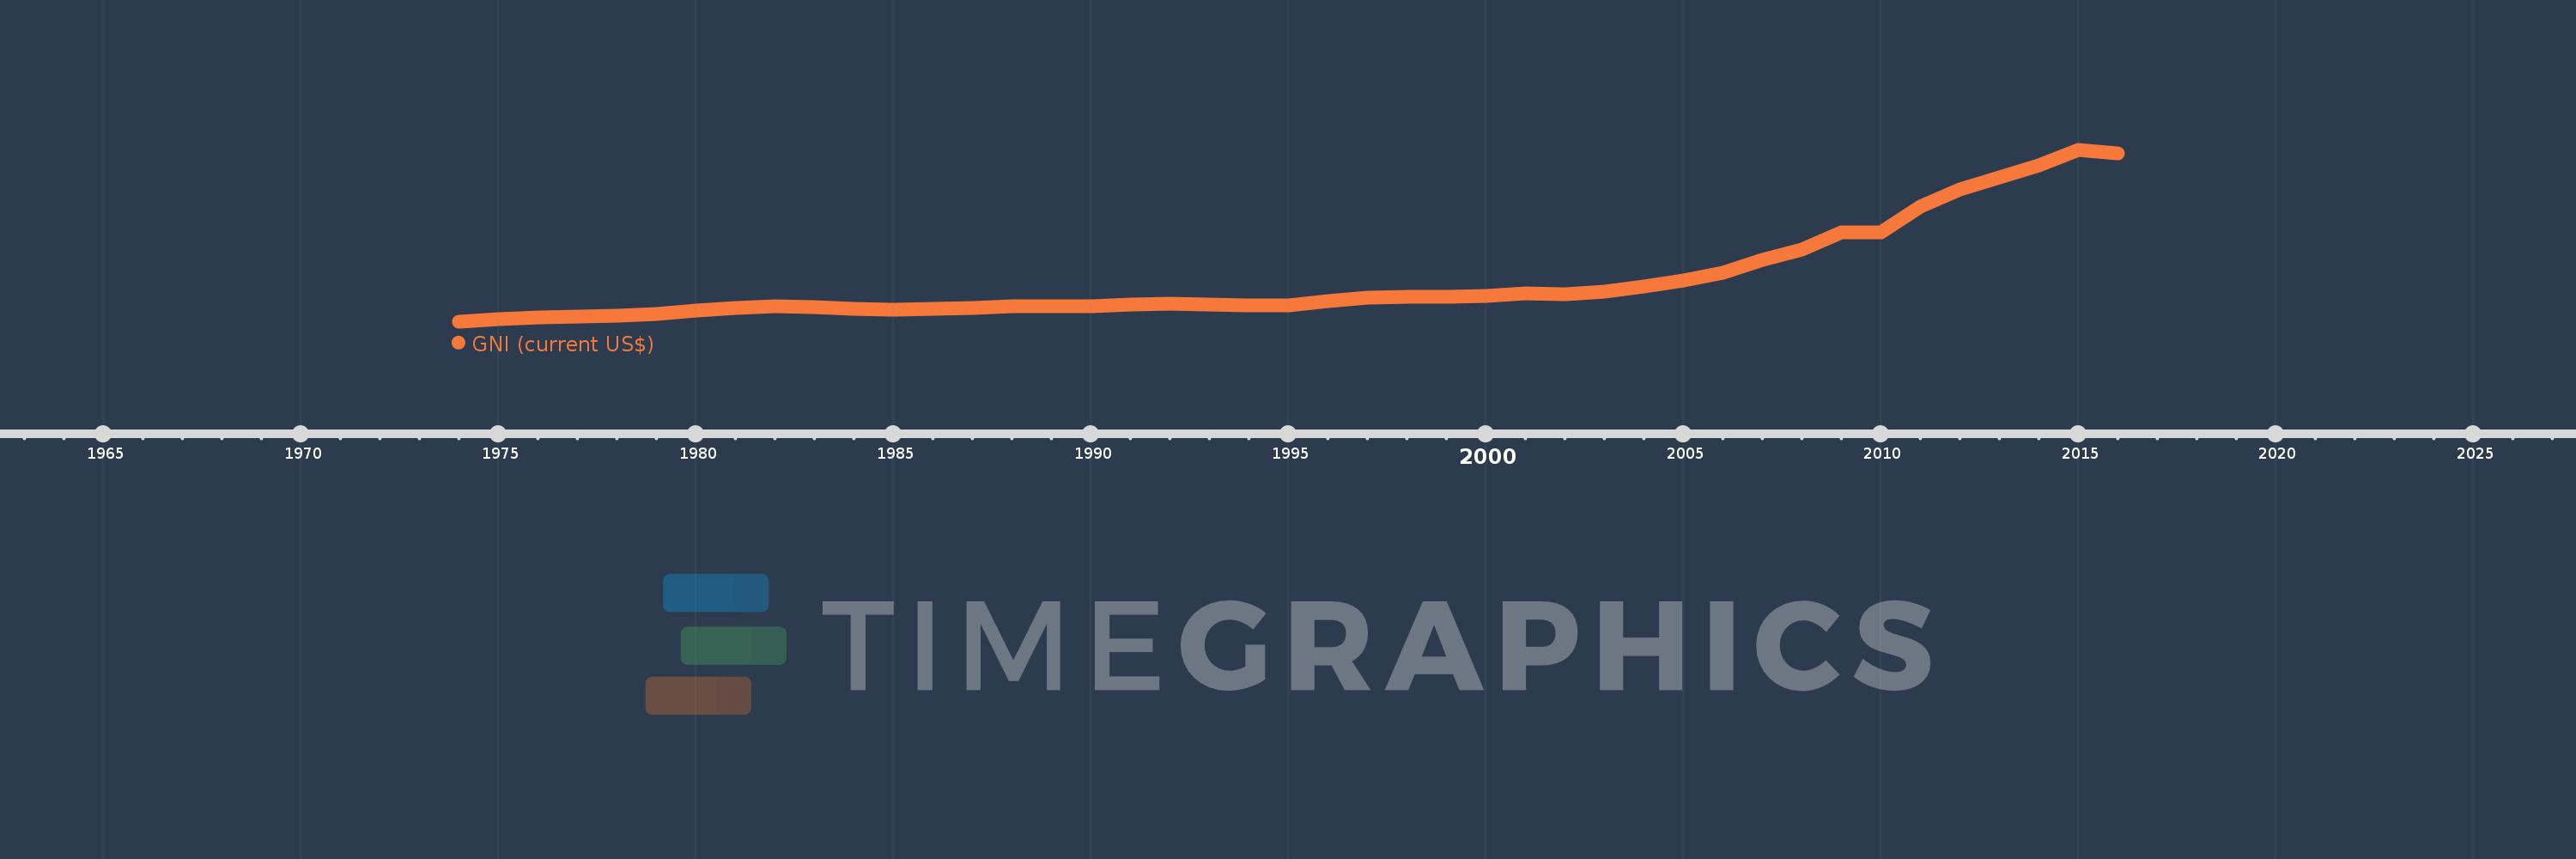
This timeline shows a graph from 1974 to 2016 of IDA total. No data until 1973. Number of actual observations by date: 43.
Source name:
World Development Indicators
Source organization:
World Bank national accounts data, and OECD National Accounts data files.
Categories, topics:
Economy & Growth, External Debt
Last updated:
apr 23, 2017
Indicators value changes by year
Minimum:
96.697 bln
jan 1, 1974
Maximum:
2.339 trl
jan 1, 2015
At the date of observation
Value
Absolute change
Change from previous value
jan 1, 1974
96.697 bln
+96.697 bln
0.0%
jan 1, 1975
133.925 bln
+37.228 bln
38.5%
jan 1, 1976
161.586 bln
+27.661 bln
20.65%
jan 1, 1977
168.989 bln
+7.403 bln
4.58%
jan 1, 1978
183.657 bln
+14.668 bln
8.68%
jan 1, 1979
204.968 bln
+21.311 bln
11.6%
jan 1, 1980
242.211 bln
+37.243 bln
18.17%
jan 1, 1981
284.806 bln
+42.595 bln
17.59%
jan 1, 1982
300.598 bln
+15.793 bln
5.55%
jan 1, 1983
289.323 bln
-11.275 bln
-3.75%
jan 1, 1984
264.278 bln
-25.045 bln
-8.66%
jan 1, 1985
262.433 bln
-1.844 bln
-0.7%
jan 1, 1986
270.455 bln
+8.022 bln
3.06%
jan 1, 1987
273.863 bln
+3.408 bln
1.26%
jan 1, 1988
296.815 bln
+22.951 bln
8.38%
jan 1, 1989
306.443 bln
+9.628 bln
3.24%
jan 1, 1990
303.185 bln
-3.258 bln
-1.06%
jan 1, 1991
319.872 bln
+16.687 bln
5.5%
jan 1, 1992
330.595 bln
+10.723 bln
3.35%
jan 1, 1993
326.933 bln
-3.662 bln
-1.11%
jan 1, 1994
318.278 bln
-8.655 bln
-2.65%
jan 1, 1995
316.005 bln
-2.273 bln
-0.71%
jan 1, 1996
368.492 bln
+52.487 bln
16.61%
jan 1, 1997
408.732 bln
+40.24 bln
10.92%
jan 1, 1998
424.635 bln
+15.904 bln
3.89%
jan 1, 1999
425.269 bln
+633.478 mln
0.15%
jan 1, 2000
431.893 bln
+6.624 bln
1.56%
jan 1, 2001
468.184 bln
+36.292 bln
8.4%
jan 1, 2002
458.604 bln
-9.581 bln
-2.05%
jan 1, 2003
490.863 bln
+32.259 bln
7.03%
jan 1, 2004
555.39 bln
+64.527 bln
13.15%
jan 1, 2005
642.236 bln
+86.847 bln
15.64%
jan 1, 2006
742.465 bln
+100.228 bln
15.61%
jan 1, 2007
901.835 bln
+159.37 bln
21.47%
jan 1, 2008
1.047 trl
+145.535 bln
16.14%
jan 1, 2009
1.269 trl
+221.437 bln
21.14%
jan 1, 2010
1.263 trl
-5.769 bln
-0.45%
jan 1, 2011
1.605 trl
+341.617 bln
27.05%
jan 1, 2012
1.83 trl
+225.224 bln
14.04%
jan 1, 2013
1.988 trl
+158.375 bln
8.65%
jan 1, 2014
2.138 trl
+150.081 bln
7.55%
jan 1, 2015
2.339 trl
+200.742 bln
9.39%
jan 1, 2016
2.295 trl
-43.799 bln
-1.87%
Ranking of countries by current statistics by years


Comments: