29
/
en
AIzaSyAYiBZKx7MnpbEhh9jyipgxe19OcubqV5w
April 1, 2024
265789
Tonga
TON
true
2
1
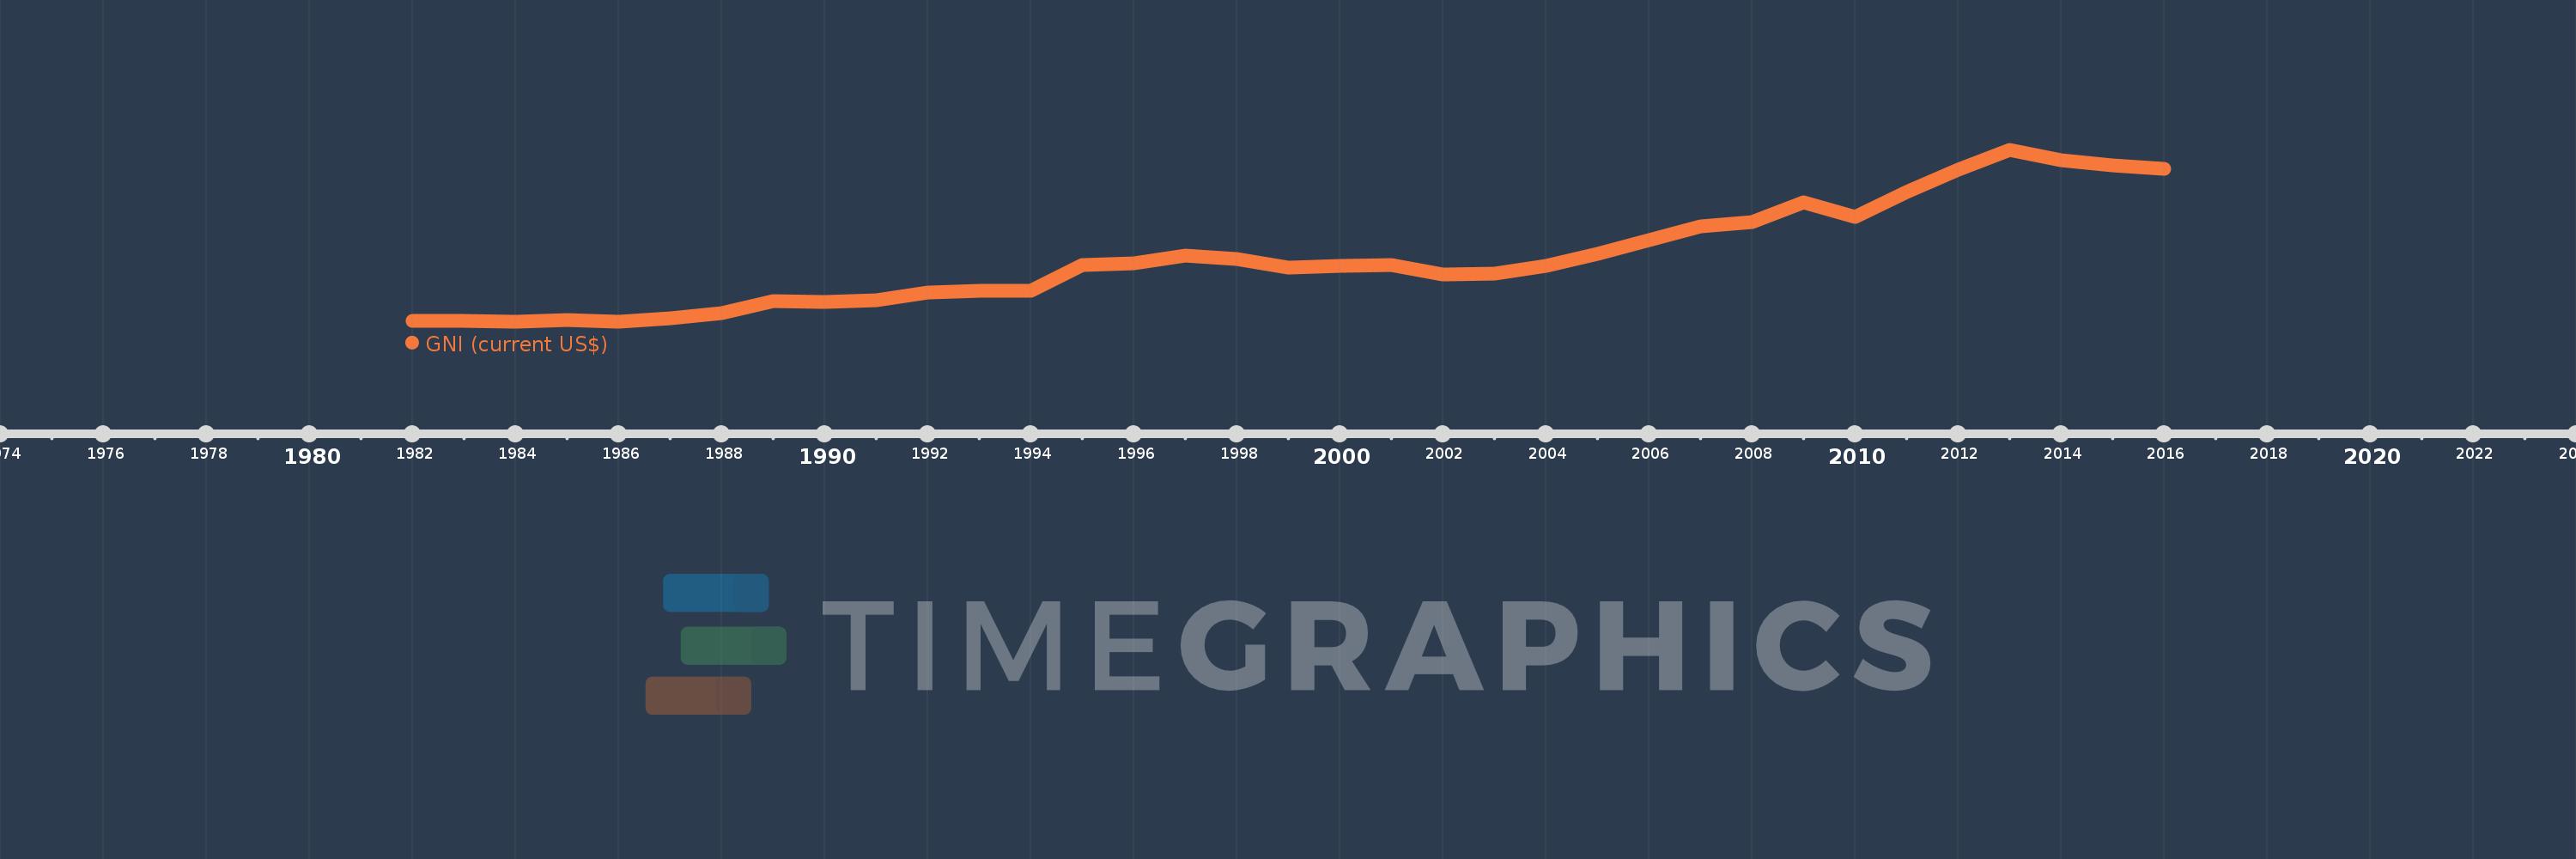
GNI (current US$)
2016,2015,2014,2013,2012,2011,2010,2009,2008,2007,2006,2005,2004,2003,2002,2001,2000,1999,1998,1997,1996,1995,1994,1993,1992,1991,1990,1989,1988,1987,1986,1985,1984,1983,1982
This statistics in other country:
AfghanistanAlbaniaAlgeriaAmerican SamoaAndorraAngolaAntigua and BarbudaArab WorldArgentinaArmeniaAustraliaAustriaAzerbaijanBahamas, TheBahrainBangladeshBarbadosBelarusBelgiumBelizeBeninBermudaBhutanBoliviaBosnia and HerzegovinaBotswanaBrazilBrunei DarussalamBulgariaBurkina FasoBurundiCabo VerdeCambodiaCameroonCanadaCaribbean small statesCentral African RepublicCentral Europe and the BalticsChadChannel IslandsChileChinaColombiaComorosCongo, Dem. Rep.Congo, Rep.Costa RicaCote d'IvoireCroatiaCubaCyprusCzech RepublicDenmarkDjiboutiDominicaDominican RepublicEarly-demographic dividendEast Asia & PacificEast Asia & Pacific (excluding high income)East Asia & Pacific (IDA & IBRD countries)EcuadorEgypt, Arab Rep.El SalvadorEquatorial GuineaEritreaEstoniaEthiopiaEuro areaEurope & Central AsiaEurope & Central Asia (excluding high income)Europe & Central Asia (IDA & IBRD countries)European UnionFaroe IslandsFijiFinlandFragile and conflict affected situationsFranceFrench PolynesiaGabonGambia, TheGeorgiaGermanyGhanaGreeceGreenlandGrenadaGuatemalaGuineaGuinea-BissauGuyanaHaitiHeavily indebted poor countries (HIPC)High incomeHondurasHong Kong SAR, ChinaHungaryIBRD onlyIcelandIDA & IBRD totalIDA blendIDA onlyIDA totalIndiaIndonesiaIran, Islamic Rep.IraqIrelandIsle of ManIsraelItalyJamaicaJapanJordanKazakhstanKenyaKiribatiKorea, Rep.KosovoKuwaitKyrgyz RepublicLao PDRLate-demographic dividendLatin America & Caribbean Latin America & Caribbean (excluding high income)Latin America & the Caribbean (IDA & IBRD countries)LatviaLeast developed countries: UN classificationLebanonLesothoLiberiaLibyaLiechtensteinLithuaniaLow & middle incomeLow incomeLower middle incomeLuxembourgMacao SAR, ChinaMacedonia, FYRMadagascarMalawiMalaysiaMaldivesMaliMaltaMarshall IslandsMauritaniaMauritiusMexicoMicronesia, Fed. Sts.Middle East & North AfricaMiddle East & North Africa (excluding high income)Middle East & North Africa (IDA & IBRD countries)Middle incomeMoldovaMonacoMongoliaMontenegroMoroccoMozambiqueMyanmarNamibiaNauruNepalNetherlandsNew CaledoniaNew ZealandNicaraguaNigerNigeriaNorth AmericaNorwayOECD membersOmanOther small statesPacific island small statesPakistanPalauPanamaPapua New GuineaParaguayPeruPhilippinesPolandPortugalPost-demographic dividendPre-demographic dividendPuerto RicoQatarRomaniaRussian FederationRwandaSamoaSan MarinoSao Tome and PrincipeSaudi ArabiaSenegalSerbiaSeychellesSierra LeoneSingaporeSlovak RepublicSloveniaSmall statesSolomon IslandsSomaliaSouth AfricaSouth AsiaSouth Asia (IDA & IBRD)South SudanSpainSri LankaSt. Kitts and NevisSt. LuciaSt. Vincent and the GrenadinesSub-Saharan Africa Sub-Saharan Africa (excluding high income)Sub-Saharan Africa (IDA & IBRD countries)SudanSurinameSwazilandSwedenSwitzerlandSyrian Arab RepublicTajikistanTanzaniaThailandTimor-LesteTogoTongaTrinidad and TobagoTunisiaTurkeyTurkmenistanTuvaluUgandaUkraineUnited Arab EmiratesUnited KingdomUnited StatesUpper middle incomeUruguayUzbekistanVanuatuVenezuela, RBVietnamVirgin Islands (U.S.)West Bank and GazaWorldYemen, Rep.ZambiaZimbabwe Timeline:
This timeline shows a graph from 1982 to 2016 of Tonga. No data until 1981. Number of actual observations by date: 35.
Source name:
World Development Indicators
Source organization:
World Bank national accounts data, and OECD National Accounts data files.
Categories, topics:
Economy & Growth, External Debt
Last updated:
apr 23, 2017
Indicators value changes by year
Minimum:
62.433 mln
jan 1, 1984
Maximum:
484.538 mln
jan 1, 2013
At the date of observation
Value
Absolute change
Change from previous value
jan 1, 1982
66.103 mln
+66.103 mln
0.0%
jan 1, 1983
65.118 mln
-985.029K
-1.49%
jan 1, 1984
62.433 mln
-2.685 mln
-4.12%
jan 1, 1985
66.29 mln
+3.857 mln
6.18%
jan 1, 1986
62.703 mln
-3.587 mln
-5.41%
jan 1, 1987
71.941 mln
+9.238 mln
14.73%
jan 1, 1988
85.038 mln
+13.097 mln
18.2%
jan 1, 1989
113.979 mln
+28.942 mln
34.03%
jan 1, 1990
110.654 mln
-3.325 mln
-2.92%
jan 1, 1991
116.505 mln
+5.851 mln
5.29%
jan 1, 1992
134.516 mln
+18.012 mln
15.46%
jan 1, 1993
138.576 mln
+4.06 mln
3.02%
jan 1, 1994
139.56 mln
+983.77K
0.71%
jan 1, 1995
202.606 mln
+63.046 mln
45.18%
jan 1, 1996
206.227 mln
+3.621 mln
1.79%
jan 1, 1997
224.596 mln
+18.369 mln
8.91%
jan 1, 1998
217.211 mln
-7.385 mln
-3.29%
jan 1, 1999
196.566 mln
-20.645 mln
-9.5%
jan 1, 2000
199.612 mln
+3.046 mln
1.55%
jan 1, 2001
201.589 mln
+1.977 mln
0.99%
jan 1, 2002
180.105 mln
-21.483 mln
-10.66%
jan 1, 2003
182.203 mln
+2.097 mln
1.16%
jan 1, 2004
201.03 mln
+18.827 mln
10.33%
jan 1, 2005
228.984 mln
+27.954 mln
13.91%
jan 1, 2006
263.759 mln
+34.775 mln
15.19%
jan 1, 2007
296.964 mln
+33.205 mln
12.59%
jan 1, 2008
307.321 mln
+10.357 mln
3.49%
jan 1, 2009
356.52 mln
+49.198 mln
16.01%
jan 1, 2010
321.124 mln
-35.396 mln
-9.93%
jan 1, 2011
381.371 mln
+60.248 mln
18.76%
jan 1, 2012
435.966 mln
+54.594 mln
14.32%
jan 1, 2013
484.538 mln
+48.573 mln
11.14%
jan 1, 2014
460.791 mln
-23.748 mln
-4.9%
jan 1, 2015
448.194 mln
-12.597 mln
-2.73%
jan 1, 2016
439.64 mln
-8.554 mln
-1.91%
Ranking of countries by current statistics by years


Comments: