29
/
en
AIzaSyAYiBZKx7MnpbEhh9jyipgxe19OcubqV5w
April 1, 2024
92603
Brunei Darussalam
BRN
true
2
1
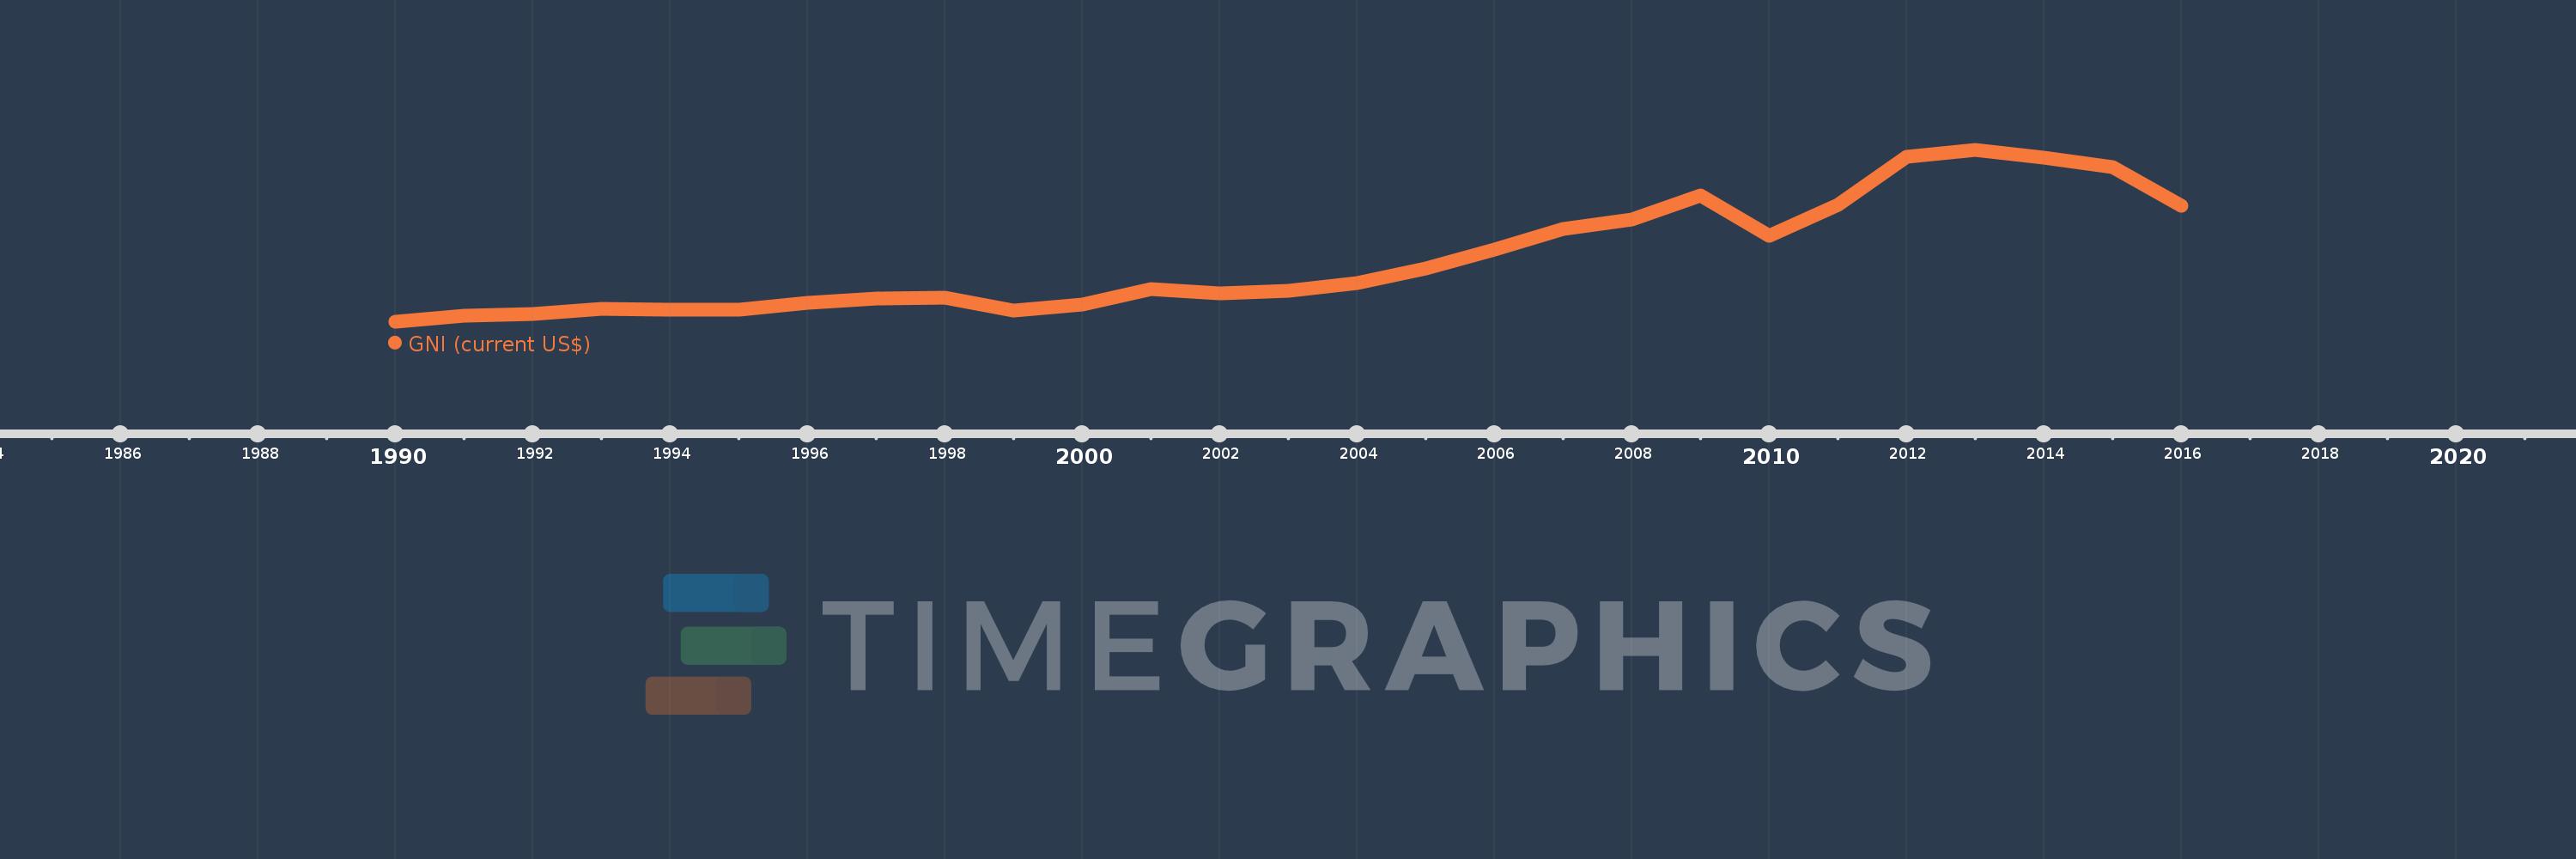
GNI (current US$)
2016,2015,2014,2013,2012,2011,2010,2009,2008,2007,2006,2005,2004,2003,2002,2001,2000,1999,1998,1997,1996,1995,1994,1993,1992,1991,1990
This statistics in other country:
AfghanistanAlbaniaAlgeriaAmerican SamoaAndorraAngolaAntigua and BarbudaArab WorldArgentinaArmeniaAustraliaAustriaAzerbaijanBahamas, TheBahrainBangladeshBarbadosBelarusBelgiumBelizeBeninBermudaBhutanBoliviaBosnia and HerzegovinaBotswanaBrazilBrunei DarussalamBulgariaBurkina FasoBurundiCabo VerdeCambodiaCameroonCanadaCaribbean small statesCentral African RepublicCentral Europe and the BalticsChadChannel IslandsChileChinaColombiaComorosCongo, Dem. Rep.Congo, Rep.Costa RicaCote d'IvoireCroatiaCubaCyprusCzech RepublicDenmarkDjiboutiDominicaDominican RepublicEarly-demographic dividendEast Asia & PacificEast Asia & Pacific (excluding high income)East Asia & Pacific (IDA & IBRD countries)EcuadorEgypt, Arab Rep.El SalvadorEquatorial GuineaEritreaEstoniaEthiopiaEuro areaEurope & Central AsiaEurope & Central Asia (excluding high income)Europe & Central Asia (IDA & IBRD countries)European UnionFaroe IslandsFijiFinlandFragile and conflict affected situationsFranceFrench PolynesiaGabonGambia, TheGeorgiaGermanyGhanaGreeceGreenlandGrenadaGuatemalaGuineaGuinea-BissauGuyanaHaitiHeavily indebted poor countries (HIPC)High incomeHondurasHong Kong SAR, ChinaHungaryIBRD onlyIcelandIDA & IBRD totalIDA blendIDA onlyIDA totalIndiaIndonesiaIran, Islamic Rep.IraqIrelandIsle of ManIsraelItalyJamaicaJapanJordanKazakhstanKenyaKiribatiKorea, Rep.KosovoKuwaitKyrgyz RepublicLao PDRLate-demographic dividendLatin America & Caribbean Latin America & Caribbean (excluding high income)Latin America & the Caribbean (IDA & IBRD countries)LatviaLeast developed countries: UN classificationLebanonLesothoLiberiaLibyaLiechtensteinLithuaniaLow & middle incomeLow incomeLower middle incomeLuxembourgMacao SAR, ChinaMacedonia, FYRMadagascarMalawiMalaysiaMaldivesMaliMaltaMarshall IslandsMauritaniaMauritiusMexicoMicronesia, Fed. Sts.Middle East & North AfricaMiddle East & North Africa (excluding high income)Middle East & North Africa (IDA & IBRD countries)Middle incomeMoldovaMonacoMongoliaMontenegroMoroccoMozambiqueMyanmarNamibiaNauruNepalNetherlandsNew CaledoniaNew ZealandNicaraguaNigerNigeriaNorth AmericaNorwayOECD membersOmanOther small statesPacific island small statesPakistanPalauPanamaPapua New GuineaParaguayPeruPhilippinesPolandPortugalPost-demographic dividendPre-demographic dividendPuerto RicoQatarRomaniaRussian FederationRwandaSamoaSan MarinoSao Tome and PrincipeSaudi ArabiaSenegalSerbiaSeychellesSierra LeoneSingaporeSlovak RepublicSloveniaSmall statesSolomon IslandsSomaliaSouth AfricaSouth AsiaSouth Asia (IDA & IBRD)South SudanSpainSri LankaSt. Kitts and NevisSt. LuciaSt. Vincent and the GrenadinesSub-Saharan Africa Sub-Saharan Africa (excluding high income)Sub-Saharan Africa (IDA & IBRD countries)SudanSurinameSwazilandSwedenSwitzerlandSyrian Arab RepublicTajikistanTanzaniaThailandTimor-LesteTogoTongaTrinidad and TobagoTunisiaTurkeyTurkmenistanTuvaluUgandaUkraineUnited Arab EmiratesUnited KingdomUnited StatesUpper middle incomeUruguayUzbekistanVanuatuVenezuela, RBVietnamVirgin Islands (U.S.)West Bank and GazaWorldYemen, Rep.ZambiaZimbabwe Timeline:
This timeline shows a graph from 1990 to 2016 of Brunei Darussalam. No data until 1989. Number of actual observations by date: 27.
Source name:
World Development Indicators
Source organization:
World Bank national accounts data, and OECD National Accounts data files.
Categories, topics:
Economy & Growth, External Debt
Last updated:
apr 23, 2017
Indicators value changes by year
Minimum:
2.985 bln
jan 1, 1990
Maximum:
18.591 bln
jan 1, 2013
At the date of observation
Value
Absolute change
Change from previous value
jan 1, 1990
2.985 bln
+2.985 bln
0.0%
jan 1, 1991
3.521 bln
+535.084 mln
17.92%
jan 1, 1992
3.702 bln
+181.115 mln
5.14%
jan 1, 1993
4.184 bln
+481.881 mln
13.02%
jan 1, 1994
4.106 bln
-77.842 mln
-1.86%
jan 1, 1995
4.087 bln
-18.368 mln
-0.45%
jan 1, 1996
4.734 bln
+646.682 mln
15.82%
jan 1, 1997
5.116 bln
+381.583 mln
8.06%
jan 1, 1998
5.197 bln
+81.73 mln
1.6%
jan 1, 1999
4.051 bln
-1.146 bln
-22.05%
jan 1, 2000
4.6 bln
+548.853 mln
13.55%
jan 1, 2001
6.001 bln
+1.401 bln
30.46%
jan 1, 2002
5.601 bln
-400.063 mln
-6.67%
jan 1, 2003
5.843 bln
+242.239 mln
4.32%
jan 1, 2004
6.557 bln
+714.004 mln
12.22%
jan 1, 2005
7.872 bln
+1.315 bln
20.05%
jan 1, 2006
9.531 bln
+1.659 bln
21.07%
jan 1, 2007
11.471 bln
+1.939 bln
20.35%
jan 1, 2008
12.31 bln
+839.391 mln
7.32%
jan 1, 2009
14.448 bln
+2.138 bln
17.36%
jan 1, 2010
10.784 bln
-3.663 bln
-25.35%
jan 1, 2011
13.607 bln
+2.822 bln
26.17%
jan 1, 2012
18.027 bln
+4.42 bln
32.48%
jan 1, 2013
18.591 bln
+563.879 mln
3.13%
jan 1, 2014
17.893 bln
-697.527 mln
-3.75%
jan 1, 2015
17.083 bln
-810.35 mln
-4.53%
jan 1, 2016
13.553 bln
-3.53 bln
-20.66%
Ranking of countries by current statistics by years


Comments: