29
/
en
AIzaSyAYiBZKx7MnpbEhh9jyipgxe19OcubqV5w
April 1, 2024
112268
Costa Rica
CRI
true
2
1
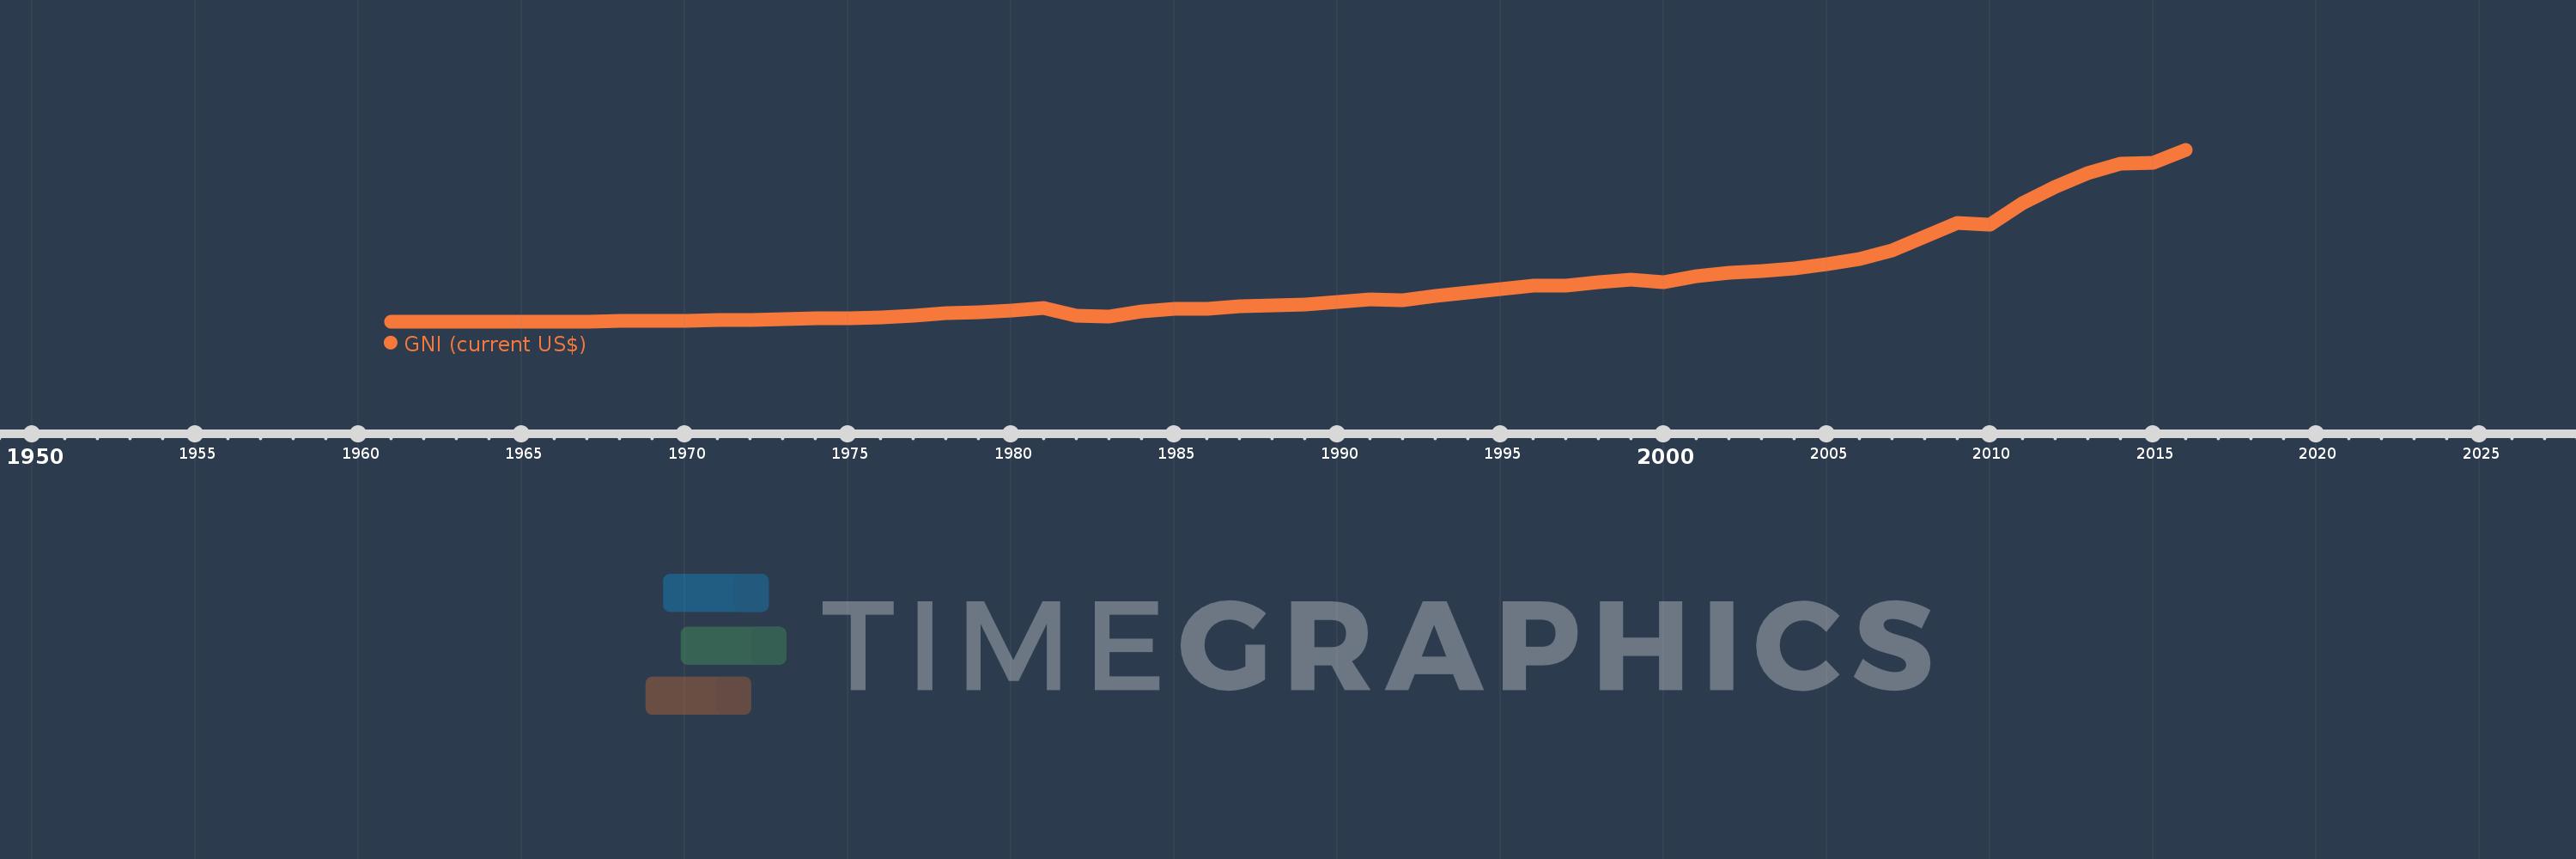
GNI (current US$)
2016,2015,2014,2013,2012,2011,2010,2009,2008,2007,2006,2005,2004,2003,2002,2001,2000,1999,1998,1997,1996,1995,1994,1993,1992,1991,1990,1989,1988,1987,1986,1985,1984,1983,1982,1981,1980,1979,1978,1977,1976,1975,1974,1973,1972,1971,1970,1969,1968,1967,1966,1965,1964,1963,1962,1961
This statistics in other country:
AfghanistanAlbaniaAlgeriaAmerican SamoaAndorraAngolaAntigua and BarbudaArab WorldArgentinaArmeniaAustraliaAustriaAzerbaijanBahamas, TheBahrainBangladeshBarbadosBelarusBelgiumBelizeBeninBermudaBhutanBoliviaBosnia and HerzegovinaBotswanaBrazilBrunei DarussalamBulgariaBurkina FasoBurundiCabo VerdeCambodiaCameroonCanadaCaribbean small statesCentral African RepublicCentral Europe and the BalticsChadChannel IslandsChileChinaColombiaComorosCongo, Dem. Rep.Congo, Rep.Costa RicaCote d'IvoireCroatiaCubaCyprusCzech RepublicDenmarkDjiboutiDominicaDominican RepublicEarly-demographic dividendEast Asia & PacificEast Asia & Pacific (excluding high income)East Asia & Pacific (IDA & IBRD countries)EcuadorEgypt, Arab Rep.El SalvadorEquatorial GuineaEritreaEstoniaEthiopiaEuro areaEurope & Central AsiaEurope & Central Asia (excluding high income)Europe & Central Asia (IDA & IBRD countries)European UnionFaroe IslandsFijiFinlandFragile and conflict affected situationsFranceFrench PolynesiaGabonGambia, TheGeorgiaGermanyGhanaGreeceGreenlandGrenadaGuatemalaGuineaGuinea-BissauGuyanaHaitiHeavily indebted poor countries (HIPC)High incomeHondurasHong Kong SAR, ChinaHungaryIBRD onlyIcelandIDA & IBRD totalIDA blendIDA onlyIDA totalIndiaIndonesiaIran, Islamic Rep.IraqIrelandIsle of ManIsraelItalyJamaicaJapanJordanKazakhstanKenyaKiribatiKorea, Rep.KosovoKuwaitKyrgyz RepublicLao PDRLate-demographic dividendLatin America & Caribbean Latin America & Caribbean (excluding high income)Latin America & the Caribbean (IDA & IBRD countries)LatviaLeast developed countries: UN classificationLebanonLesothoLiberiaLibyaLiechtensteinLithuaniaLow & middle incomeLow incomeLower middle incomeLuxembourgMacao SAR, ChinaMacedonia, FYRMadagascarMalawiMalaysiaMaldivesMaliMaltaMarshall IslandsMauritaniaMauritiusMexicoMicronesia, Fed. Sts.Middle East & North AfricaMiddle East & North Africa (excluding high income)Middle East & North Africa (IDA & IBRD countries)Middle incomeMoldovaMonacoMongoliaMontenegroMoroccoMozambiqueMyanmarNamibiaNauruNepalNetherlandsNew CaledoniaNew ZealandNicaraguaNigerNigeriaNorth AmericaNorwayOECD membersOmanOther small statesPacific island small statesPakistanPalauPanamaPapua New GuineaParaguayPeruPhilippinesPolandPortugalPost-demographic dividendPre-demographic dividendPuerto RicoQatarRomaniaRussian FederationRwandaSamoaSan MarinoSao Tome and PrincipeSaudi ArabiaSenegalSerbiaSeychellesSierra LeoneSingaporeSlovak RepublicSloveniaSmall statesSolomon IslandsSomaliaSouth AfricaSouth AsiaSouth Asia (IDA & IBRD)South SudanSpainSri LankaSt. Kitts and NevisSt. LuciaSt. Vincent and the GrenadinesSub-Saharan Africa Sub-Saharan Africa (excluding high income)Sub-Saharan Africa (IDA & IBRD countries)SudanSurinameSwazilandSwedenSwitzerlandSyrian Arab RepublicTajikistanTanzaniaThailandTimor-LesteTogoTongaTrinidad and TobagoTunisiaTurkeyTurkmenistanTuvaluUgandaUkraineUnited Arab EmiratesUnited KingdomUnited StatesUpper middle incomeUruguayUzbekistanVanuatuVenezuela, RBVietnamVirgin Islands (U.S.)West Bank and GazaWorldYemen, Rep.ZambiaZimbabwe Timeline:
This timeline shows a graph from 1961 to 2016 of Costa Rica. No data until 1960. Number of actual observations by date: 56.
Source name:
World Development Indicators
Source organization:
World Bank national accounts data, and OECD National Accounts data files.
Categories, topics:
Economy & Growth, External Debt
Last updated:
apr 23, 2017
Indicators value changes by year
Minimum:
469.635 mln
jan 1, 1963
Maximum:
51.767 bln
jan 1, 2016
At the date of observation
Value
Absolute change
Change from previous value
jan 1, 1961
502.758 mln
+502.758 mln
0.0%
jan 1, 1962
485.021 mln
-17.737 mln
-3.53%
jan 1, 1963
469.635 mln
-15.386 mln
-3.17%
jan 1, 1964
503.109 mln
+33.475 mln
7.13%
jan 1, 1965
531.162 mln
+28.053 mln
5.58%
jan 1, 1966
578.881 mln
+47.719 mln
8.98%
jan 1, 1967
631.806 mln
+52.924 mln
9.14%
jan 1, 1968
681.857 mln
+50.051 mln
7.92%
jan 1, 1969
754.641 mln
+72.785 mln
10.67%
jan 1, 1970
837.73 mln
+83.089 mln
11.01%
jan 1, 1971
969.03 mln
+131.3 mln
15.67%
jan 1, 1972
1.06 bln
+91.072 mln
9.4%
jan 1, 1973
1.201 bln
+140.584 mln
13.26%
jan 1, 1974
1.488 bln
+287.459 mln
23.94%
jan 1, 1975
1.625 bln
+136.668 mln
9.18%
jan 1, 1976
1.895 bln
+270.122 mln
16.62%
jan 1, 1977
2.337 bln
+441.999 mln
23.33%
jan 1, 1978
2.993 bln
+655.793 mln
28.06%
jan 1, 1979
3.41 bln
+417.182 mln
13.94%
jan 1, 1980
3.886 bln
+475.911 mln
13.96%
jan 1, 1981
4.615 bln
+729.528 mln
18.77%
jan 1, 1982
2.34 bln
-2.276 bln
-49.31%
jan 1, 1983
2.203 bln
-136.986 mln
-5.85%
jan 1, 1984
3.643 bln
+1.44 bln
65.38%
jan 1, 1985
4.292 bln
+649.154 mln
17.82%
jan 1, 1986
4.514 bln
+222.42 mln
5.18%
jan 1, 1987
5.204 bln
+689.567 mln
15.27%
jan 1, 1988
5.544 bln
+340.038 mln
6.53%
jan 1, 1989
5.727 bln
+182.926 mln
3.3%
jan 1, 1990
6.465 bln
+737.543 mln
12.88%
jan 1, 1991
7.151 bln
+686.455 mln
10.62%
jan 1, 1992
6.995 bln
-155.858 mln
-2.18%
jan 1, 1993
8.326 bln
+1.331 bln
19.03%
jan 1, 1994
9.312 bln
+985.904 mln
11.84%
jan 1, 1995
10.304 bln
+992.322 mln
10.66%
jan 1, 1996
11.288 bln
+983.753 mln
9.55%
jan 1, 1997
11.434 bln
+146.074 mln
1.29%
jan 1, 1998
12.303 bln
+869.065 mln
7.6%
jan 1, 1999
13.149 bln
+845.784 mln
6.87%
jan 1, 2000
12.374 bln
-774.899 mln
-5.89%
jan 1, 2001
14.237 bln
+1.863 bln
15.06%
jan 1, 2002
15.164 bln
+927.341 mln
6.51%
jan 1, 2003
15.728 bln
+563.806 mln
3.72%
jan 1, 2004
16.39 bln
+661.863 mln
4.21%
jan 1, 2005
17.72 bln
+1.33 bln
8.12%
jan 1, 2006
19.153 bln
+1.432 bln
8.08%
jan 1, 2007
21.891 bln
+2.738 bln
14.3%
jan 1, 2008
26.042 bln
+4.151 bln
18.96%
jan 1, 2009
29.985 bln
+3.944 bln
15.14%
jan 1, 2010
29.497 bln
-488.273 mln
-1.63%
jan 1, 2011
36.042 bln
+6.545 bln
22.19%
jan 1, 2012
40.836 bln
+4.794 bln
13.3%
jan 1, 2013
45.017 bln
+4.181 bln
10.24%
jan 1, 2014
47.812 bln
+2.794 bln
6.21%
jan 1, 2015
48.1 bln
+288.69 mln
0.6%
jan 1, 2016
51.767 bln
+3.666 bln
7.62%
Ranking of countries by current statistics by years


Comments: