29
/
en
AIzaSyAYiBZKx7MnpbEhh9jyipgxe19OcubqV5w
April 1, 2024
124821
Egypt, Arab Rep.
EGY
true
2
1
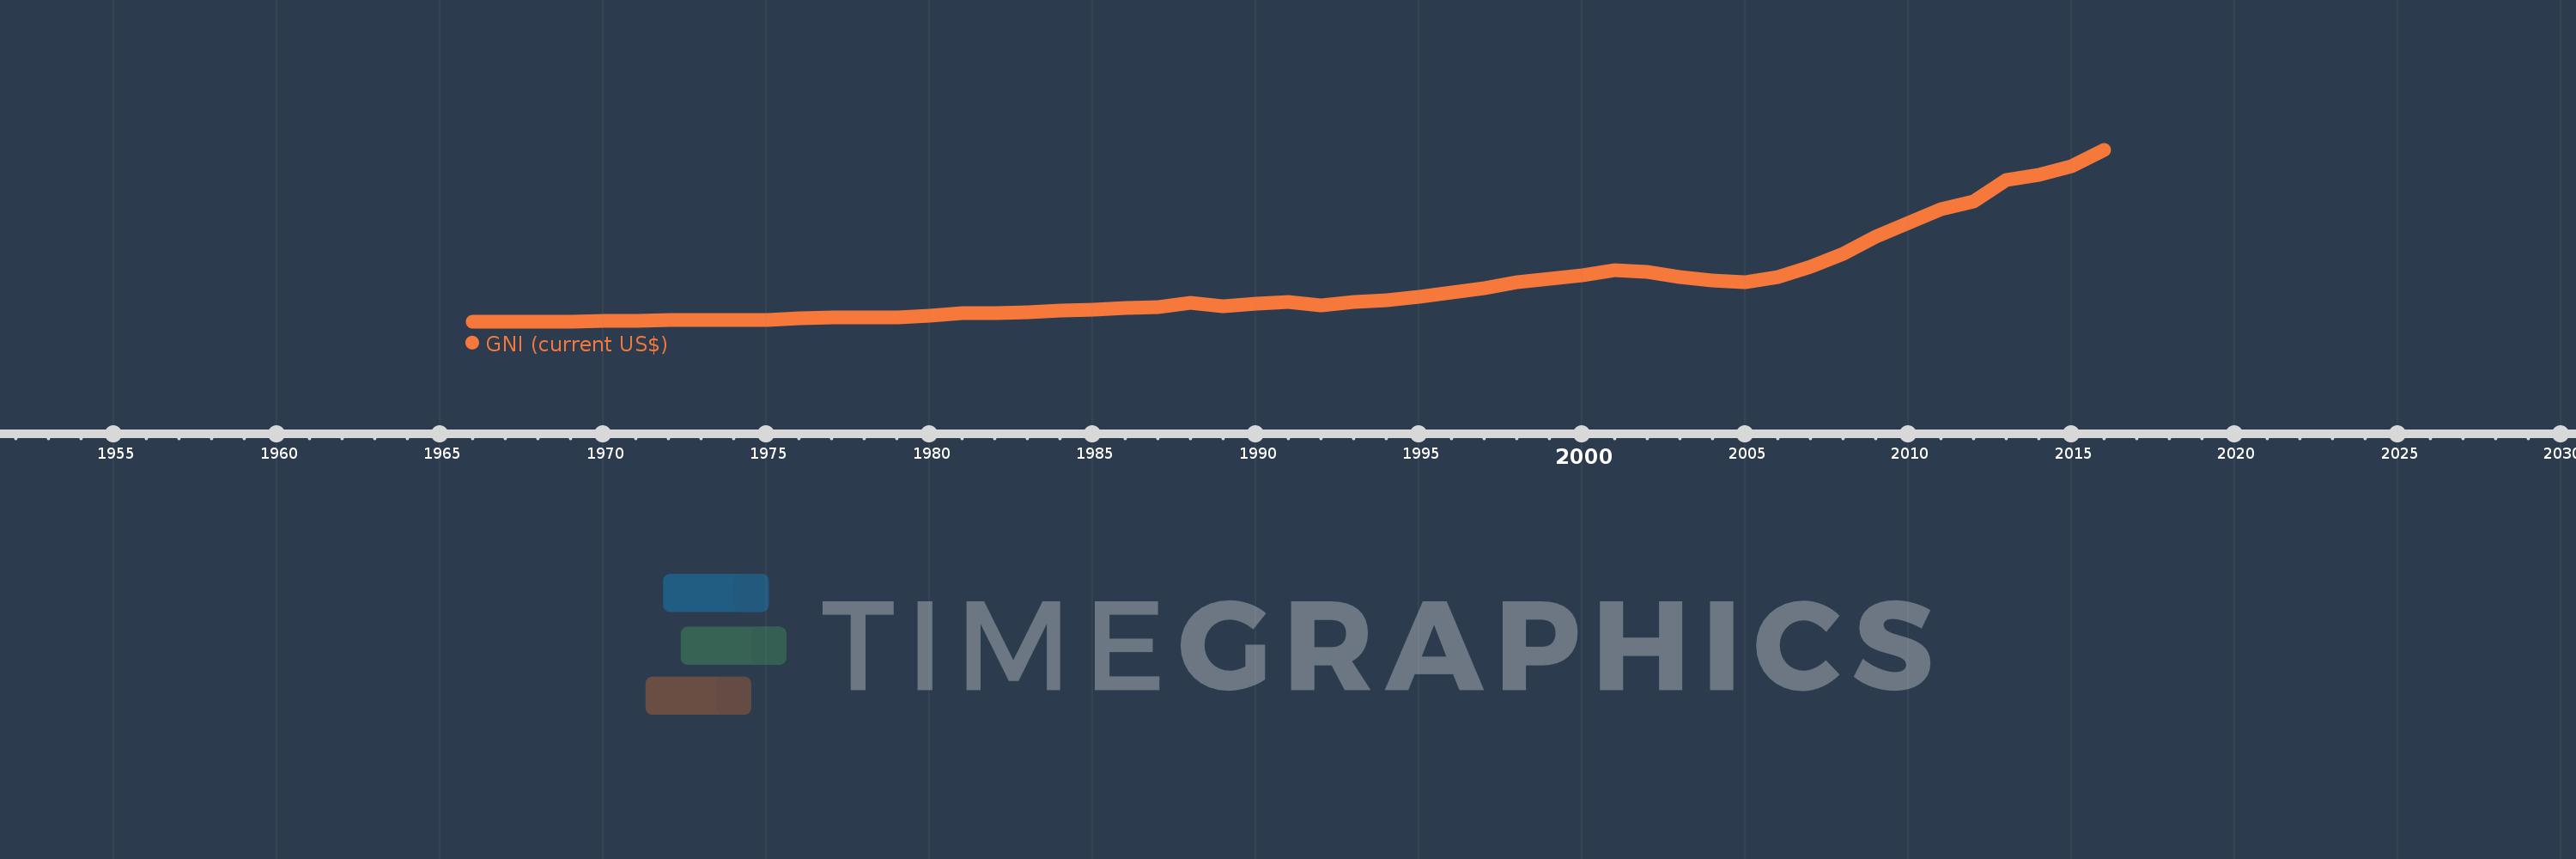
GNI (current US$)
2016,2015,2014,2013,2012,2011,2010,2009,2008,2007,2006,2005,2004,2003,2002,2001,2000,1999,1998,1997,1996,1995,1994,1993,1992,1991,1990,1989,1988,1987,1986,1985,1984,1983,1982,1981,1980,1979,1978,1977,1976,1975,1974,1973,1972,1971,1970,1969,1968,1967,1966
This statistics in other country:
AfghanistanAlbaniaAlgeriaAmerican SamoaAndorraAngolaAntigua and BarbudaArab WorldArgentinaArmeniaAustraliaAustriaAzerbaijanBahamas, TheBahrainBangladeshBarbadosBelarusBelgiumBelizeBeninBermudaBhutanBoliviaBosnia and HerzegovinaBotswanaBrazilBrunei DarussalamBulgariaBurkina FasoBurundiCabo VerdeCambodiaCameroonCanadaCaribbean small statesCentral African RepublicCentral Europe and the BalticsChadChannel IslandsChileChinaColombiaComorosCongo, Dem. Rep.Congo, Rep.Costa RicaCote d'IvoireCroatiaCubaCyprusCzech RepublicDenmarkDjiboutiDominicaDominican RepublicEarly-demographic dividendEast Asia & PacificEast Asia & Pacific (excluding high income)East Asia & Pacific (IDA & IBRD countries)EcuadorEgypt, Arab Rep.El SalvadorEquatorial GuineaEritreaEstoniaEthiopiaEuro areaEurope & Central AsiaEurope & Central Asia (excluding high income)Europe & Central Asia (IDA & IBRD countries)European UnionFaroe IslandsFijiFinlandFragile and conflict affected situationsFranceFrench PolynesiaGabonGambia, TheGeorgiaGermanyGhanaGreeceGreenlandGrenadaGuatemalaGuineaGuinea-BissauGuyanaHaitiHeavily indebted poor countries (HIPC)High incomeHondurasHong Kong SAR, ChinaHungaryIBRD onlyIcelandIDA & IBRD totalIDA blendIDA onlyIDA totalIndiaIndonesiaIran, Islamic Rep.IraqIrelandIsle of ManIsraelItalyJamaicaJapanJordanKazakhstanKenyaKiribatiKorea, Rep.KosovoKuwaitKyrgyz RepublicLao PDRLate-demographic dividendLatin America & Caribbean Latin America & Caribbean (excluding high income)Latin America & the Caribbean (IDA & IBRD countries)LatviaLeast developed countries: UN classificationLebanonLesothoLiberiaLibyaLiechtensteinLithuaniaLow & middle incomeLow incomeLower middle incomeLuxembourgMacao SAR, ChinaMacedonia, FYRMadagascarMalawiMalaysiaMaldivesMaliMaltaMarshall IslandsMauritaniaMauritiusMexicoMicronesia, Fed. Sts.Middle East & North AfricaMiddle East & North Africa (excluding high income)Middle East & North Africa (IDA & IBRD countries)Middle incomeMoldovaMonacoMongoliaMontenegroMoroccoMozambiqueMyanmarNamibiaNauruNepalNetherlandsNew CaledoniaNew ZealandNicaraguaNigerNigeriaNorth AmericaNorwayOECD membersOmanOther small statesPacific island small statesPakistanPalauPanamaPapua New GuineaParaguayPeruPhilippinesPolandPortugalPost-demographic dividendPre-demographic dividendPuerto RicoQatarRomaniaRussian FederationRwandaSamoaSan MarinoSao Tome and PrincipeSaudi ArabiaSenegalSerbiaSeychellesSierra LeoneSingaporeSlovak RepublicSloveniaSmall statesSolomon IslandsSomaliaSouth AfricaSouth AsiaSouth Asia (IDA & IBRD)South SudanSpainSri LankaSt. Kitts and NevisSt. LuciaSt. Vincent and the GrenadinesSub-Saharan Africa Sub-Saharan Africa (excluding high income)Sub-Saharan Africa (IDA & IBRD countries)SudanSurinameSwazilandSwedenSwitzerlandSyrian Arab RepublicTajikistanTanzaniaThailandTimor-LesteTogoTongaTrinidad and TobagoTunisiaTurkeyTurkmenistanTuvaluUgandaUkraineUnited Arab EmiratesUnited KingdomUnited StatesUpper middle incomeUruguayUzbekistanVanuatuVenezuela, RBVietnamVirgin Islands (U.S.)West Bank and GazaWorldYemen, Rep.ZambiaZimbabwe Timeline:
This timeline shows a graph from 1966 to 2016 of Egypt, Arab Rep.. No data until 1965. Number of actual observations by date: 51.
Source name:
World Development Indicators
Source organization:
World Bank national accounts data, and OECD National Accounts data files.
Categories, topics:
Economy & Growth, External Debt
Last updated:
apr 23, 2017
Indicators value changes by year
Minimum:
5.072 bln
jan 1, 1966
Maximum:
324.703 bln
jan 1, 2016
At the date of observation
Value
Absolute change
Change from previous value
jan 1, 1966
5.072 bln
+5.072 bln
0.0%
jan 1, 1967
5.3 bln
+228.156 mln
4.5%
jan 1, 1968
5.554 bln
+254.158 mln
4.8%
jan 1, 1969
6.086 bln
+532.035 mln
9.58%
jan 1, 1970
6.803 bln
+716.448 mln
11.77%
jan 1, 1971
7.618 bln
+815.775 mln
11.99%
jan 1, 1972
8.193 bln
+574.37 mln
7.54%
jan 1, 1973
8.695 bln
+502.641 mln
6.14%
jan 1, 1974
9.493 bln
+797.223 mln
9.17%
jan 1, 1975
8.896 bln
-596.558 mln
-6.28%
jan 1, 1976
11.194 bln
+2.298 bln
25.83%
jan 1, 1977
13.018 bln
+1.824 bln
16.3%
jan 1, 1978
14.211 bln
+1.193 bln
9.16%
jan 1, 1979
14.187 bln
-24.084 mln
-0.17%
jan 1, 1980
17.081 bln
+2.894 bln
20.4%
jan 1, 1981
21.453 bln
+4.372 bln
25.59%
jan 1, 1982
21.74 bln
+287.628 mln
1.34%
jan 1, 1983
23.808 bln
+2.068 bln
9.51%
jan 1, 1984
26.259 bln
+2.451 bln
10.29%
jan 1, 1985
28.58 bln
+2.321 bln
8.84%
jan 1, 1986
31.406 bln
+2.826 bln
9.89%
jan 1, 1987
32.068 bln
+661.928 mln
2.11%
jan 1, 1988
39.986 bln
+7.919 bln
24.69%
jan 1, 1989
34.836 bln
-5.15 bln
-12.88%
jan 1, 1990
39.139 bln
+4.303 bln
12.35%
jan 1, 1991
42.025 bln
+2.886 bln
7.38%
jan 1, 1992
36.608 bln
-5.417 bln
-12.89%
jan 1, 1993
41.531 bln
+4.923 bln
13.45%
jan 1, 1994
46.007 bln
+4.476 bln
10.78%
jan 1, 1995
51.776 bln
+5.769 bln
12.54%
jan 1, 1996
60.3 bln
+8.524 bln
16.46%
jan 1, 1997
68.168 bln
+7.868 bln
13.05%
jan 1, 1998
79.404 bln
+11.236 bln
16.48%
jan 1, 1999
86.042 bln
+6.638 bln
8.36%
jan 1, 2000
91.715 bln
+5.673 bln
6.59%
jan 1, 2001
100.77 bln
+9.055 bln
9.87%
jan 1, 2002
98.704 bln
-2.067 bln
-2.05%
jan 1, 2003
87.947 bln
-10.757 bln
-10.9%
jan 1, 2004
82.817 bln
-5.129 bln
-5.83%
jan 1, 2005
78.631 bln
-4.186 bln
-5.06%
jan 1, 2006
89.432 bln
+10.801 bln
13.74%
jan 1, 2007
108.015 bln
+18.583 bln
20.78%
jan 1, 2008
131.656 bln
+23.641 bln
21.89%
jan 1, 2009
164.178 bln
+32.522 bln
24.7%
jan 1, 2010
189.136 bln
+24.958 bln
15.2%
jan 1, 2011
214.526 bln
+25.39 bln
13.42%
jan 1, 2012
229.952 bln
+15.427 bln
7.19%
jan 1, 2013
269.873 bln
+39.921 bln
17.36%
jan 1, 2014
278.605 bln
+8.732 bln
3.24%
jan 1, 2015
294.203 bln
+15.598 bln
5.6%
jan 1, 2016
324.703 bln
+30.5 bln
10.37%
Ranking of countries by current statistics by years


Comments: