29
/
en
AIzaSyAYiBZKx7MnpbEhh9jyipgxe19OcubqV5w
April 1, 2024
31601
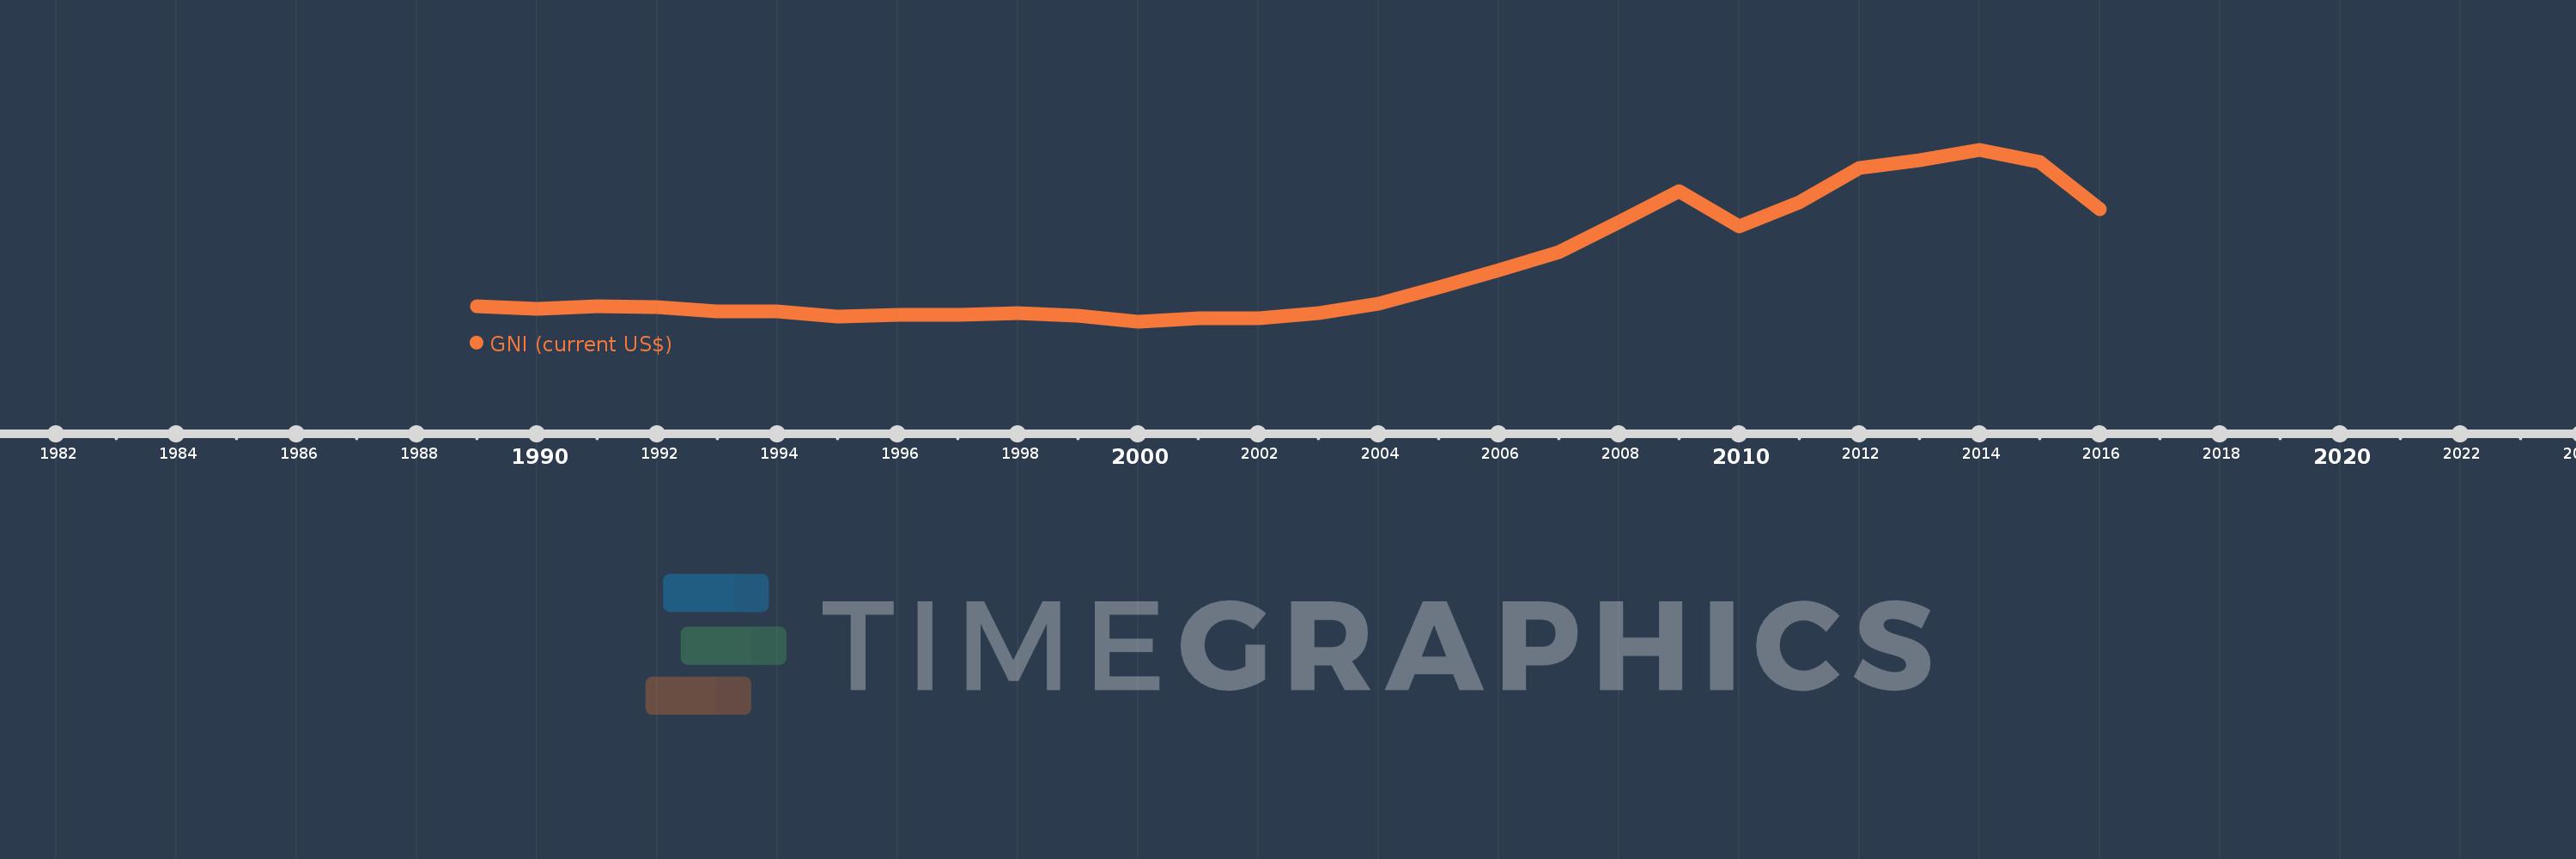
Europe & Central Asia (excluding high income)
ECA
false
2
1
GNI (current US$)
2016,2015,2014,2013,2012,2011,2010,2009,2008,2007,2006,2005,2004,2003,2002,2001,2000,1999,1998,1997,1996,1995,1994,1993,1992,1991,1990,1989
This statistics in other country:
AfghanistanAlbaniaAlgeriaAmerican SamoaAndorraAngolaAntigua and BarbudaArab WorldArgentinaArmeniaAustraliaAustriaAzerbaijanBahamas, TheBahrainBangladeshBarbadosBelarusBelgiumBelizeBeninBermudaBhutanBoliviaBosnia and HerzegovinaBotswanaBrazilBrunei DarussalamBulgariaBurkina FasoBurundiCabo VerdeCambodiaCameroonCanadaCaribbean small statesCentral African RepublicCentral Europe and the BalticsChadChannel IslandsChileChinaColombiaComorosCongo, Dem. Rep.Congo, Rep.Costa RicaCote d'IvoireCroatiaCubaCyprusCzech RepublicDenmarkDjiboutiDominicaDominican RepublicEarly-demographic dividendEast Asia & PacificEast Asia & Pacific (excluding high income)East Asia & Pacific (IDA & IBRD countries)EcuadorEgypt, Arab Rep.El SalvadorEquatorial GuineaEritreaEstoniaEthiopiaEuro areaEurope & Central AsiaEurope & Central Asia (excluding high income)Europe & Central Asia (IDA & IBRD countries)European UnionFaroe IslandsFijiFinlandFragile and conflict affected situationsFranceFrench PolynesiaGabonGambia, TheGeorgiaGermanyGhanaGreeceGreenlandGrenadaGuatemalaGuineaGuinea-BissauGuyanaHaitiHeavily indebted poor countries (HIPC)High incomeHondurasHong Kong SAR, ChinaHungaryIBRD onlyIcelandIDA & IBRD totalIDA blendIDA onlyIDA totalIndiaIndonesiaIran, Islamic Rep.IraqIrelandIsle of ManIsraelItalyJamaicaJapanJordanKazakhstanKenyaKiribatiKorea, Rep.KosovoKuwaitKyrgyz RepublicLao PDRLate-demographic dividendLatin America & Caribbean Latin America & Caribbean (excluding high income)Latin America & the Caribbean (IDA & IBRD countries)LatviaLeast developed countries: UN classificationLebanonLesothoLiberiaLibyaLiechtensteinLithuaniaLow & middle incomeLow incomeLower middle incomeLuxembourgMacao SAR, ChinaMacedonia, FYRMadagascarMalawiMalaysiaMaldivesMaliMaltaMarshall IslandsMauritaniaMauritiusMexicoMicronesia, Fed. Sts.Middle East & North AfricaMiddle East & North Africa (excluding high income)Middle East & North Africa (IDA & IBRD countries)Middle incomeMoldovaMonacoMongoliaMontenegroMoroccoMozambiqueMyanmarNamibiaNauruNepalNetherlandsNew CaledoniaNew ZealandNicaraguaNigerNigeriaNorth AmericaNorwayOECD membersOmanOther small statesPacific island small statesPakistanPalauPanamaPapua New GuineaParaguayPeruPhilippinesPolandPortugalPost-demographic dividendPre-demographic dividendPuerto RicoQatarRomaniaRussian FederationRwandaSamoaSan MarinoSao Tome and PrincipeSaudi ArabiaSenegalSerbiaSeychellesSierra LeoneSingaporeSlovak RepublicSloveniaSmall statesSolomon IslandsSomaliaSouth AfricaSouth AsiaSouth Asia (IDA & IBRD)South SudanSpainSri LankaSt. Kitts and NevisSt. LuciaSt. Vincent and the GrenadinesSub-Saharan Africa Sub-Saharan Africa (excluding high income)Sub-Saharan Africa (IDA & IBRD countries)SudanSurinameSwazilandSwedenSwitzerlandSyrian Arab RepublicTajikistanTanzaniaThailandTimor-LesteTogoTongaTrinidad and TobagoTunisiaTurkeyTurkmenistanTuvaluUgandaUkraineUnited Arab EmiratesUnited KingdomUnited StatesUpper middle incomeUruguayUzbekistanVanuatuVenezuela, RBVietnamVirgin Islands (U.S.)West Bank and GazaWorldYemen, Rep.ZambiaZimbabwe Timeline:
This timeline shows a graph from 1989 to 2016 of Europe & Central Asia (excluding high income). No data until 1988. Number of actual observations by date: 28.
Source name:
World Development Indicators
Source organization:
World Bank national accounts data, and OECD National Accounts data files.
Categories, topics:
Economy & Growth, External Debt
Last updated:
apr 23, 2017
Indicators value changes by year
Minimum:
607.748 bln
jan 1, 2000
Maximum:
3.988 trl
jan 1, 2014
At the date of observation
Value
Absolute change
Change from previous value
jan 1, 1989
911.927 bln
+911.927 bln
0.0%
jan 1, 1990
865.603 bln
-46.324 bln
-5.08%
jan 1, 1991
925.186 bln
+59.582 bln
6.88%
jan 1, 1992
899.668 bln
-25.518 bln
-2.76%
jan 1, 1993
823.284 bln
-76.383 bln
-8.49%
jan 1, 1994
811.047 bln
-12.237 bln
-1.49%
jan 1, 1995
706.373 bln
-104.674 bln
-12.91%
jan 1, 1996
751.983 bln
+45.61 bln
6.46%
jan 1, 1997
755.936 bln
+3.953 bln
0.53%
jan 1, 1998
782.38 bln
+26.444 bln
3.5%
jan 1, 1999
723.259 bln
-59.121 bln
-7.56%
jan 1, 2000
607.748 bln
-115.511 bln
-15.97%
jan 1, 2001
677.95 bln
+70.202 bln
11.55%
jan 1, 2002
677.142 bln
-807.588 mln
-0.12%
jan 1, 2003
773.593 bln
+96.451 bln
14.24%
jan 1, 2004
970.843 bln
+197.25 bln
25.5%
jan 1, 2005
1.288 trl
+316.805 bln
32.63%
jan 1, 2006
1.628 trl
+340.116 bln
26.41%
jan 1, 2007
1.989 trl
+361.551 bln
22.21%
jan 1, 2008
2.576 trl
+586.287 bln
29.47%
jan 1, 2009
3.18 trl
+604.637 bln
23.48%
jan 1, 2010
2.491 trl
-689.546 bln
-21.68%
jan 1, 2011
2.971 trl
+480.008 bln
19.27%
jan 1, 2012
3.642 trl
+671.652 bln
22.61%
jan 1, 2013
3.794 trl
+151.646 bln
4.16%
jan 1, 2014
3.988 trl
+194.27 bln
5.12%
jan 1, 2015
3.764 trl
-223.833 bln
-5.61%
jan 1, 2016
2.824 trl
-940.395 bln
-24.98%
Ranking of countries by current statistics by years


Comments: