29
/
en
AIzaSyAYiBZKx7MnpbEhh9jyipgxe19OcubqV5w
April 1, 2024
285917
Zambia
ZMB
true
2
1
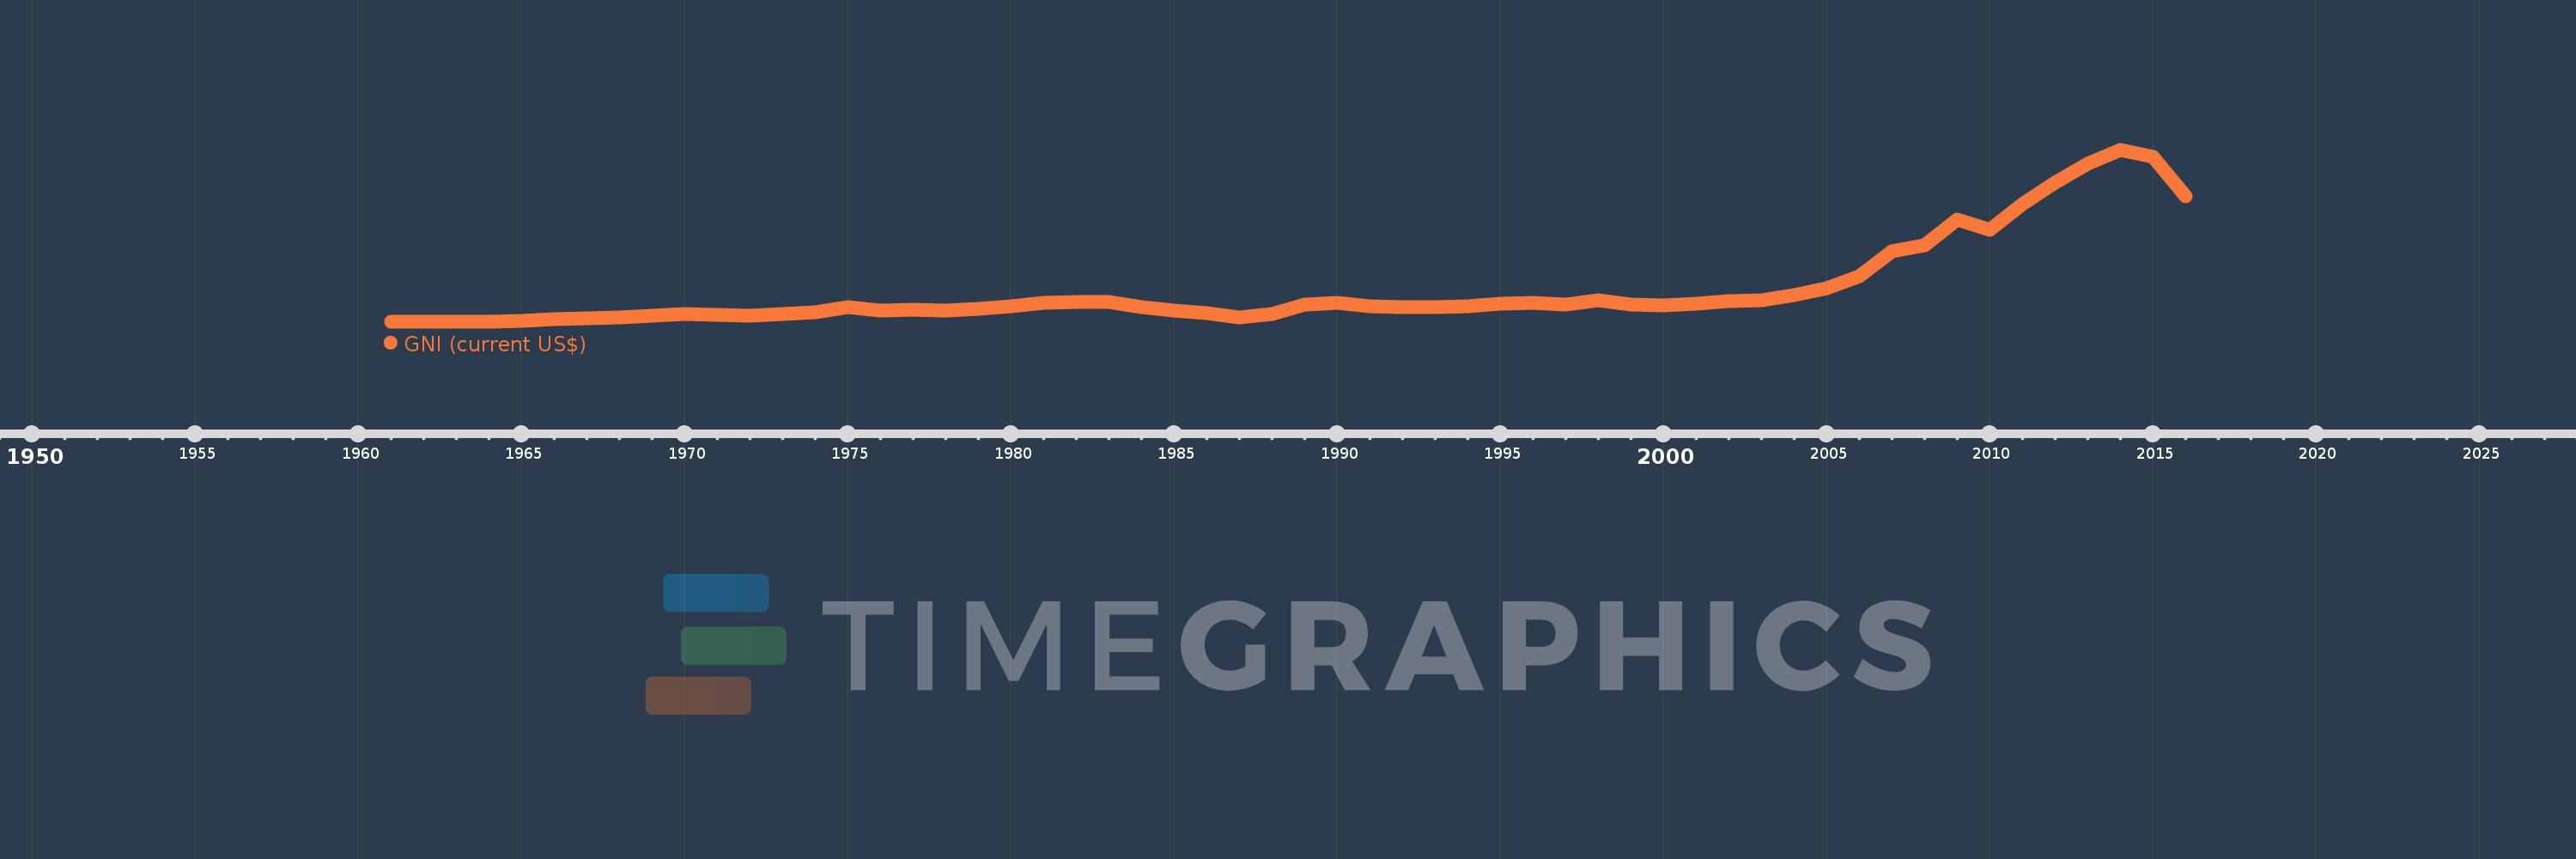
GNI (current US$)
2016,2015,2014,2013,2012,2011,2010,2009,2008,2007,2006,2005,2004,2003,2002,2001,2000,1999,1998,1997,1996,1995,1994,1993,1992,1991,1990,1989,1988,1987,1986,1985,1984,1983,1982,1981,1980,1979,1978,1977,1976,1975,1974,1973,1972,1971,1970,1969,1968,1967,1966,1965,1964,1963,1962,1961
This statistics in other country:
AfghanistanAlbaniaAlgeriaAmerican SamoaAndorraAngolaAntigua and BarbudaArab WorldArgentinaArmeniaAustraliaAustriaAzerbaijanBahamas, TheBahrainBangladeshBarbadosBelarusBelgiumBelizeBeninBermudaBhutanBoliviaBosnia and HerzegovinaBotswanaBrazilBrunei DarussalamBulgariaBurkina FasoBurundiCabo VerdeCambodiaCameroonCanadaCaribbean small statesCentral African RepublicCentral Europe and the BalticsChadChannel IslandsChileChinaColombiaComorosCongo, Dem. Rep.Congo, Rep.Costa RicaCote d'IvoireCroatiaCubaCyprusCzech RepublicDenmarkDjiboutiDominicaDominican RepublicEarly-demographic dividendEast Asia & PacificEast Asia & Pacific (excluding high income)East Asia & Pacific (IDA & IBRD countries)EcuadorEgypt, Arab Rep.El SalvadorEquatorial GuineaEritreaEstoniaEthiopiaEuro areaEurope & Central AsiaEurope & Central Asia (excluding high income)Europe & Central Asia (IDA & IBRD countries)European UnionFaroe IslandsFijiFinlandFragile and conflict affected situationsFranceFrench PolynesiaGabonGambia, TheGeorgiaGermanyGhanaGreeceGreenlandGrenadaGuatemalaGuineaGuinea-BissauGuyanaHaitiHeavily indebted poor countries (HIPC)High incomeHondurasHong Kong SAR, ChinaHungaryIBRD onlyIcelandIDA & IBRD totalIDA blendIDA onlyIDA totalIndiaIndonesiaIran, Islamic Rep.IraqIrelandIsle of ManIsraelItalyJamaicaJapanJordanKazakhstanKenyaKiribatiKorea, Rep.KosovoKuwaitKyrgyz RepublicLao PDRLate-demographic dividendLatin America & Caribbean Latin America & Caribbean (excluding high income)Latin America & the Caribbean (IDA & IBRD countries)LatviaLeast developed countries: UN classificationLebanonLesothoLiberiaLibyaLiechtensteinLithuaniaLow & middle incomeLow incomeLower middle incomeLuxembourgMacao SAR, ChinaMacedonia, FYRMadagascarMalawiMalaysiaMaldivesMaliMaltaMarshall IslandsMauritaniaMauritiusMexicoMicronesia, Fed. Sts.Middle East & North AfricaMiddle East & North Africa (excluding high income)Middle East & North Africa (IDA & IBRD countries)Middle incomeMoldovaMonacoMongoliaMontenegroMoroccoMozambiqueMyanmarNamibiaNauruNepalNetherlandsNew CaledoniaNew ZealandNicaraguaNigerNigeriaNorth AmericaNorwayOECD membersOmanOther small statesPacific island small statesPakistanPalauPanamaPapua New GuineaParaguayPeruPhilippinesPolandPortugalPost-demographic dividendPre-demographic dividendPuerto RicoQatarRomaniaRussian FederationRwandaSamoaSan MarinoSao Tome and PrincipeSaudi ArabiaSenegalSerbiaSeychellesSierra LeoneSingaporeSlovak RepublicSloveniaSmall statesSolomon IslandsSomaliaSouth AfricaSouth AsiaSouth Asia (IDA & IBRD)South SudanSpainSri LankaSt. Kitts and NevisSt. LuciaSt. Vincent and the GrenadinesSub-Saharan Africa Sub-Saharan Africa (excluding high income)Sub-Saharan Africa (IDA & IBRD countries)SudanSurinameSwazilandSwedenSwitzerlandSyrian Arab RepublicTajikistanTanzaniaThailandTimor-LesteTogoTongaTrinidad and TobagoTunisiaTurkeyTurkmenistanTuvaluUgandaUkraineUnited Arab EmiratesUnited KingdomUnited StatesUpper middle incomeUruguayUzbekistanVanuatuVenezuela, RBVietnamVirgin Islands (U.S.)West Bank and GazaWorldYemen, Rep.ZambiaZimbabwe Timeline:
This timeline shows a graph from 1961 to 2016 of Zambia. No data until 1960. Number of actual observations by date: 56.
Source name:
World Development Indicators
Source organization:
World Bank national accounts data, and OECD National Accounts data files.
Categories, topics:
Economy & Growth, External Debt
Last updated:
apr 23, 2017
Indicators value changes by year
Minimum:
623.143 mln
jan 1, 1963
Maximum:
27.292 bln
jan 1, 2014
At the date of observation
Value
Absolute change
Change from previous value
jan 1, 1961
639.0 mln
+639.0 mln
0.0%
jan 1, 1962
630.571 mln
-8.429 mln
-1.32%
jan 1, 1963
623.143 mln
-7.429 mln
-1.18%
jan 1, 1964
649.286 mln
+26.143 mln
4.2%
jan 1, 1965
740.714 mln
+91.429 mln
14.08%
jan 1, 1966
1.018 bln
+277.143 mln
37.42%
jan 1, 1967
1.181 bln
+163.571 mln
16.07%
jan 1, 1968
1.296 bln
+114.286 mln
9.67%
jan 1, 1969
1.531 bln
+235.714 mln
18.19%
jan 1, 1970
1.898 bln
+366.429 mln
23.93%
jan 1, 1971
1.778 bln
-120.286 mln
-6.34%
jan 1, 1972
1.636 bln
-141.857 mln
-7.98%
jan 1, 1973
1.82 bln
+184.143 mln
11.26%
jan 1, 1974
2.093 bln
+273.286 mln
15.02%
jan 1, 1975
2.92 bln
+826.857 mln
39.5%
jan 1, 1976
2.436 bln
-484.333 mln
-16.59%
jan 1, 1977
2.496 bln
+60.762 mln
2.49%
jan 1, 1978
2.373 bln
-123.554 mln
-4.95%
jan 1, 1979
2.637 bln
+263.875 mln
11.12%
jan 1, 1980
3.04 bln
+403.0 mln
15.28%
jan 1, 1981
3.544 bln
+504.0 mln
16.58%
jan 1, 1982
3.764 bln
+220.139 mln
6.21%
jan 1, 1983
3.751 bln
-12.667 mln
-0.34%
jan 1, 1984
2.974 bln
-777.607 mln
-20.73%
jan 1, 1985
2.461 bln
-513.004 mln
-17.25%
jan 1, 1986
2.011 bln
-449.353 mln
-18.26%
jan 1, 1987
1.356 bln
-655.656 mln
-32.6%
jan 1, 1988
1.925 bln
+569.682 mln
42.02%
jan 1, 1989
3.305 bln
+1.379 bln
71.64%
jan 1, 1990
3.591 bln
+286.743 mln
8.68%
jan 1, 1991
3.005 bln
-586.093 mln
-16.32%
jan 1, 1992
2.995 bln
-10.484 mln
-0.35%
jan 1, 1993
2.867 bln
-128.201 mln
-4.28%
jan 1, 1994
3.018 bln
+151.704 mln
5.29%
jan 1, 1995
3.42 bln
+401.998 mln
13.32%
jan 1, 1996
3.565 bln
+144.804 mln
4.23%
jan 1, 1997
3.391 bln
-173.841 mln
-4.88%
jan 1, 1998
4.052 bln
+661.261 mln
19.5%
jan 1, 1999
3.315 bln
-737.496 mln
-18.2%
jan 1, 2000
3.24 bln
-74.584 mln
-2.25%
jan 1, 2001
3.445 bln
+204.161 mln
6.3%
jan 1, 2002
3.93 bln
+484.969 mln
14.08%
jan 1, 2003
4.043 bln
+113.804 mln
2.9%
jan 1, 2004
4.759 bln
+715.436 mln
17.69%
jan 1, 2005
5.822 bln
+1.064 bln
22.35%
jan 1, 2006
7.7 bln
+1.878 bln
32.25%
jan 1, 2007
11.588 bln
+3.888 bln
50.49%
jan 1, 2008
12.512 bln
+924.128 mln
7.97%
jan 1, 2009
16.512 bln
+4.0 bln
31.97%
jan 1, 2010
14.91 bln
-1.603 bln
-9.71%
jan 1, 2011
18.903 bln
+3.993 bln
26.78%
jan 1, 2012
22.305 bln
+3.402 bln
18.0%
jan 1, 2013
25.17 bln
+2.865 bln
12.85%
jan 1, 2014
27.292 bln
+2.122 bln
8.43%
jan 1, 2015
26.243 bln
-1.049 bln
-3.85%
jan 1, 2016
20.088 bln
-6.155 bln
-23.45%
Ranking of countries by current statistics by years


Comments: