29
/
en
AIzaSyAYiBZKx7MnpbEhh9jyipgxe19OcubqV5w
April 1, 2024
34978
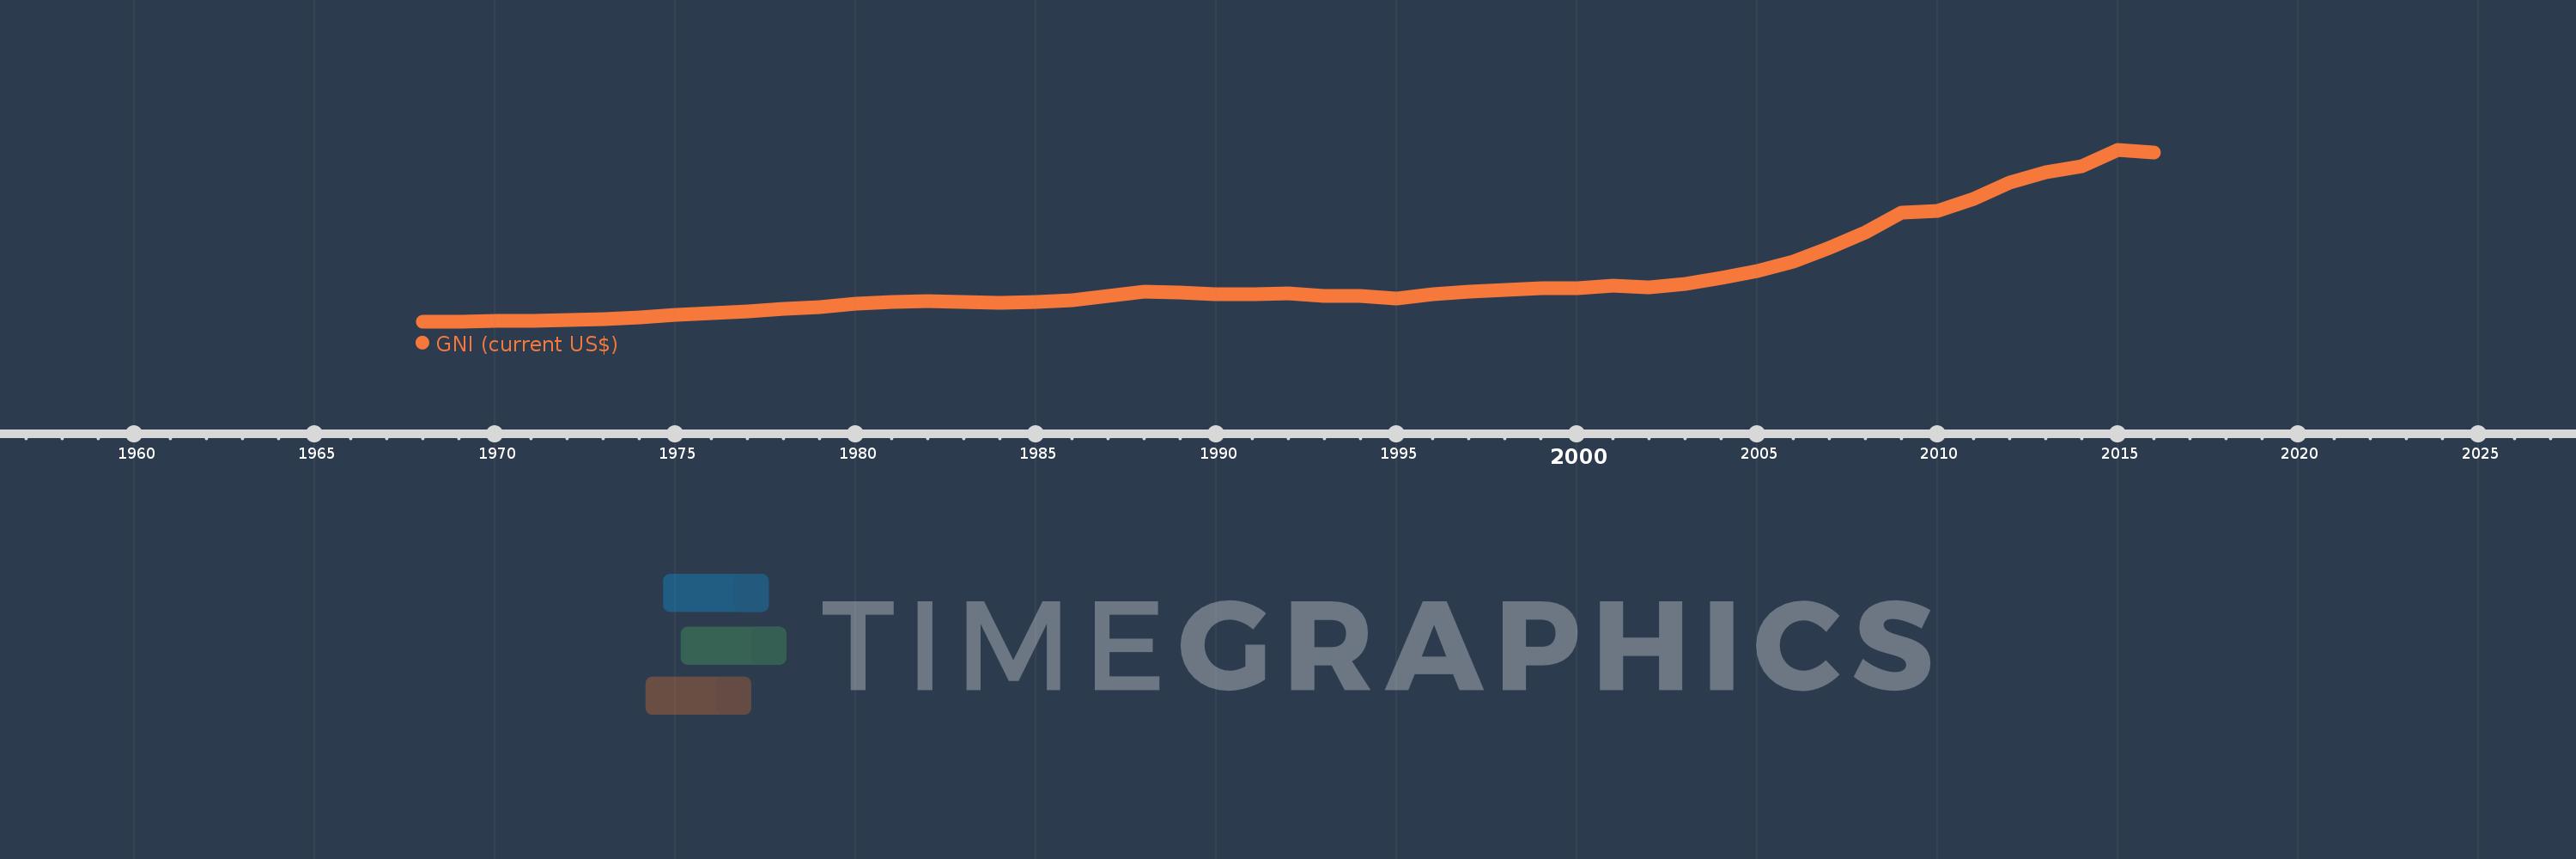
Heavily indebted poor countries (HIPC)
HPC
false
2
1
GNI (current US$)
2016,2015,2014,2013,2012,2011,2010,2009,2008,2007,2006,2005,2004,2003,2002,2001,2000,1999,1998,1997,1996,1995,1994,1993,1992,1991,1990,1989,1988,1987,1986,1985,1984,1983,1982,1981,1980,1979,1978,1977,1976,1975,1974,1973,1972,1971,1970,1969,1968
This statistics in other country:
AfghanistanAlbaniaAlgeriaAmerican SamoaAndorraAngolaAntigua and BarbudaArab WorldArgentinaArmeniaAustraliaAustriaAzerbaijanBahamas, TheBahrainBangladeshBarbadosBelarusBelgiumBelizeBeninBermudaBhutanBoliviaBosnia and HerzegovinaBotswanaBrazilBrunei DarussalamBulgariaBurkina FasoBurundiCabo VerdeCambodiaCameroonCanadaCaribbean small statesCentral African RepublicCentral Europe and the BalticsChadChannel IslandsChileChinaColombiaComorosCongo, Dem. Rep.Congo, Rep.Costa RicaCote d'IvoireCroatiaCubaCyprusCzech RepublicDenmarkDjiboutiDominicaDominican RepublicEarly-demographic dividendEast Asia & PacificEast Asia & Pacific (excluding high income)East Asia & Pacific (IDA & IBRD countries)EcuadorEgypt, Arab Rep.El SalvadorEquatorial GuineaEritreaEstoniaEthiopiaEuro areaEurope & Central AsiaEurope & Central Asia (excluding high income)Europe & Central Asia (IDA & IBRD countries)European UnionFaroe IslandsFijiFinlandFragile and conflict affected situationsFranceFrench PolynesiaGabonGambia, TheGeorgiaGermanyGhanaGreeceGreenlandGrenadaGuatemalaGuineaGuinea-BissauGuyanaHaitiHeavily indebted poor countries (HIPC)High incomeHondurasHong Kong SAR, ChinaHungaryIBRD onlyIcelandIDA & IBRD totalIDA blendIDA onlyIDA totalIndiaIndonesiaIran, Islamic Rep.IraqIrelandIsle of ManIsraelItalyJamaicaJapanJordanKazakhstanKenyaKiribatiKorea, Rep.KosovoKuwaitKyrgyz RepublicLao PDRLate-demographic dividendLatin America & Caribbean Latin America & Caribbean (excluding high income)Latin America & the Caribbean (IDA & IBRD countries)LatviaLeast developed countries: UN classificationLebanonLesothoLiberiaLibyaLiechtensteinLithuaniaLow & middle incomeLow incomeLower middle incomeLuxembourgMacao SAR, ChinaMacedonia, FYRMadagascarMalawiMalaysiaMaldivesMaliMaltaMarshall IslandsMauritaniaMauritiusMexicoMicronesia, Fed. Sts.Middle East & North AfricaMiddle East & North Africa (excluding high income)Middle East & North Africa (IDA & IBRD countries)Middle incomeMoldovaMonacoMongoliaMontenegroMoroccoMozambiqueMyanmarNamibiaNauruNepalNetherlandsNew CaledoniaNew ZealandNicaraguaNigerNigeriaNorth AmericaNorwayOECD membersOmanOther small statesPacific island small statesPakistanPalauPanamaPapua New GuineaParaguayPeruPhilippinesPolandPortugalPost-demographic dividendPre-demographic dividendPuerto RicoQatarRomaniaRussian FederationRwandaSamoaSan MarinoSao Tome and PrincipeSaudi ArabiaSenegalSerbiaSeychellesSierra LeoneSingaporeSlovak RepublicSloveniaSmall statesSolomon IslandsSomaliaSouth AfricaSouth AsiaSouth Asia (IDA & IBRD)South SudanSpainSri LankaSt. Kitts and NevisSt. LuciaSt. Vincent and the GrenadinesSub-Saharan Africa Sub-Saharan Africa (excluding high income)Sub-Saharan Africa (IDA & IBRD countries)SudanSurinameSwazilandSwedenSwitzerlandSyrian Arab RepublicTajikistanTanzaniaThailandTimor-LesteTogoTongaTrinidad and TobagoTunisiaTurkeyTurkmenistanTuvaluUgandaUkraineUnited Arab EmiratesUnited KingdomUnited StatesUpper middle incomeUruguayUzbekistanVanuatuVenezuela, RBVietnamVirgin Islands (U.S.)West Bank and GazaWorldYemen, Rep.ZambiaZimbabwe Timeline:
This timeline shows a graph from 1968 to 2016 of Heavily indebted poor countries (HIPC). No data until 1967. Number of actual observations by date: 49.
Source name:
World Development Indicators
Source organization:
World Bank national accounts data, and OECD National Accounts data files.
Categories, topics:
Economy & Growth, External Debt
Last updated:
apr 23, 2017
Indicators value changes by year
Minimum:
23.168 bln
jan 1, 1968
Maximum:
613.09 bln
jan 1, 2015
At the date of observation
Value
Absolute change
Change from previous value
jan 1, 1968
23.168 bln
+23.168 bln
0.0%
jan 1, 1969
23.956 bln
+788.241 mln
3.4%
jan 1, 1970
25.982 bln
+2.025 bln
8.45%
jan 1, 1971
27.84 bln
+1.858 bln
7.15%
jan 1, 1972
29.597 bln
+1.757 bln
6.31%
jan 1, 1973
31.924 bln
+2.327 bln
7.86%
jan 1, 1974
37.641 bln
+5.717 bln
17.91%
jan 1, 1975
46.648 bln
+9.007 bln
23.93%
jan 1, 1976
53.582 bln
+6.934 bln
14.87%
jan 1, 1977
58.354 bln
+4.772 bln
8.91%
jan 1, 1978
67.705 bln
+9.351 bln
16.02%
jan 1, 1979
75.581 bln
+7.875 bln
11.63%
jan 1, 1980
87.121 bln
+11.541 bln
15.27%
jan 1, 1981
92.069 bln
+4.947 bln
5.68%
jan 1, 1982
94.825 bln
+2.756 bln
2.99%
jan 1, 1983
92.623 bln
-2.202 bln
-2.32%
jan 1, 1984
89.094 bln
-3.529 bln
-3.81%
jan 1, 1985
92.416 bln
+3.322 bln
3.73%
jan 1, 1986
98.105 bln
+5.69 bln
6.16%
jan 1, 1987
113.316 bln
+15.211 bln
15.5%
jan 1, 1988
126.061 bln
+12.745 bln
11.25%
jan 1, 1989
123.347 bln
-2.714 bln
-2.15%
jan 1, 1990
117.266 bln
-6.082 bln
-4.93%
jan 1, 1991
119.31 bln
+2.045 bln
1.74%
jan 1, 1992
122.379 bln
+3.069 bln
2.57%
jan 1, 1993
113.442 bln
-8.937 bln
-7.3%
jan 1, 1994
113.703 bln
+260.514 mln
0.23%
jan 1, 1995
105.009 bln
-8.694 bln
-7.65%
jan 1, 1996
119.626 bln
+14.617 bln
13.92%
jan 1, 1997
126.886 bln
+7.26 bln
6.07%
jan 1, 1998
133.879 bln
+6.993 bln
5.51%
jan 1, 1999
138.728 bln
+4.85 bln
3.62%
jan 1, 2000
138.573 bln
-155.418 mln
-0.11%
jan 1, 2001
149.393 bln
+10.82 bln
7.81%
jan 1, 2002
140.668 bln
-8.725 bln
-5.84%
jan 1, 2003
153.072 bln
+12.405 bln
8.82%
jan 1, 2004
173.63 bln
+20.558 bln
13.43%
jan 1, 2005
199.488 bln
+25.858 bln
14.89%
jan 1, 2006
231.525 bln
+32.037 bln
16.06%
jan 1, 2007
277.117 bln
+45.591 bln
19.69%
jan 1, 2008
330.349 bln
+53.232 bln
19.21%
jan 1, 2009
398.459 bln
+68.111 bln
20.62%
jan 1, 2010
405.401 bln
+6.942 bln
1.74%
jan 1, 2011
445.602 bln
+40.201 bln
9.92%
jan 1, 2012
500.604 bln
+55.002 bln
12.34%
jan 1, 2013
536.64 bln
+36.036 bln
7.2%
jan 1, 2014
558.734 bln
+22.094 bln
4.12%
jan 1, 2015
613.09 bln
+54.356 bln
9.73%
jan 1, 2016
604.286 bln
-8.804 bln
-1.44%
Ranking of countries by current statistics by years


Comments: