29
/
en
AIzaSyAYiBZKx7MnpbEhh9jyipgxe19OcubqV5w
April 1, 2024
182099
Luxembourg
LUX
true
2
1
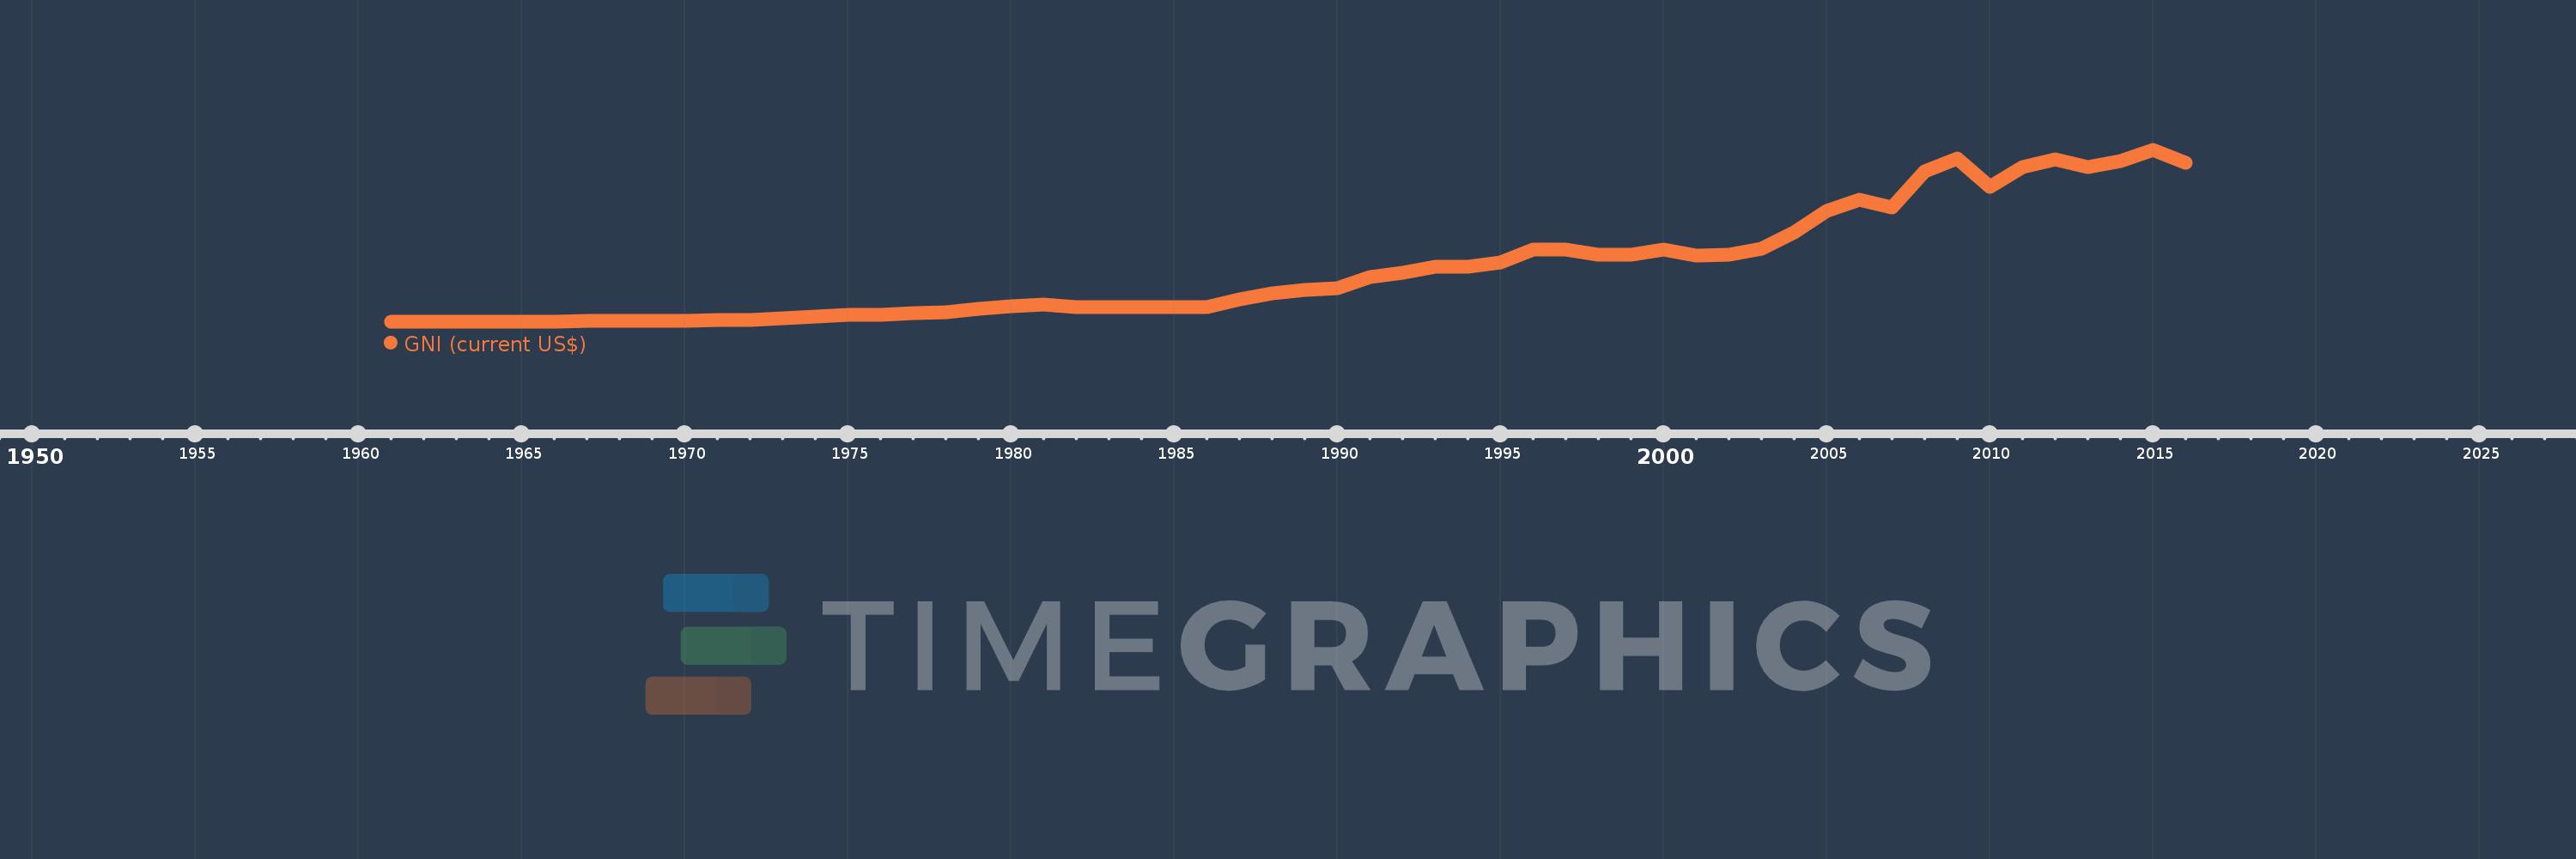
GNI (current US$)
2016,2015,2014,2013,2012,2011,2010,2009,2008,2007,2006,2005,2004,2003,2002,2001,2000,1999,1998,1997,1996,1995,1994,1993,1992,1991,1990,1989,1988,1987,1986,1985,1984,1983,1982,1981,1980,1979,1978,1977,1976,1975,1974,1973,1972,1971,1970,1969,1968,1967,1966,1965,1964,1963,1962,1961
This statistics in other country:
AfghanistanAlbaniaAlgeriaAmerican SamoaAndorraAngolaAntigua and BarbudaArab WorldArgentinaArmeniaAustraliaAustriaAzerbaijanBahamas, TheBahrainBangladeshBarbadosBelarusBelgiumBelizeBeninBermudaBhutanBoliviaBosnia and HerzegovinaBotswanaBrazilBrunei DarussalamBulgariaBurkina FasoBurundiCabo VerdeCambodiaCameroonCanadaCaribbean small statesCentral African RepublicCentral Europe and the BalticsChadChannel IslandsChileChinaColombiaComorosCongo, Dem. Rep.Congo, Rep.Costa RicaCote d'IvoireCroatiaCubaCyprusCzech RepublicDenmarkDjiboutiDominicaDominican RepublicEarly-demographic dividendEast Asia & PacificEast Asia & Pacific (excluding high income)East Asia & Pacific (IDA & IBRD countries)EcuadorEgypt, Arab Rep.El SalvadorEquatorial GuineaEritreaEstoniaEthiopiaEuro areaEurope & Central AsiaEurope & Central Asia (excluding high income)Europe & Central Asia (IDA & IBRD countries)European UnionFaroe IslandsFijiFinlandFragile and conflict affected situationsFranceFrench PolynesiaGabonGambia, TheGeorgiaGermanyGhanaGreeceGreenlandGrenadaGuatemalaGuineaGuinea-BissauGuyanaHaitiHeavily indebted poor countries (HIPC)High incomeHondurasHong Kong SAR, ChinaHungaryIBRD onlyIcelandIDA & IBRD totalIDA blendIDA onlyIDA totalIndiaIndonesiaIran, Islamic Rep.IraqIrelandIsle of ManIsraelItalyJamaicaJapanJordanKazakhstanKenyaKiribatiKorea, Rep.KosovoKuwaitKyrgyz RepublicLao PDRLate-demographic dividendLatin America & Caribbean Latin America & Caribbean (excluding high income)Latin America & the Caribbean (IDA & IBRD countries)LatviaLeast developed countries: UN classificationLebanonLesothoLiberiaLibyaLiechtensteinLithuaniaLow & middle incomeLow incomeLower middle incomeLuxembourgMacao SAR, ChinaMacedonia, FYRMadagascarMalawiMalaysiaMaldivesMaliMaltaMarshall IslandsMauritaniaMauritiusMexicoMicronesia, Fed. Sts.Middle East & North AfricaMiddle East & North Africa (excluding high income)Middle East & North Africa (IDA & IBRD countries)Middle incomeMoldovaMonacoMongoliaMontenegroMoroccoMozambiqueMyanmarNamibiaNauruNepalNetherlandsNew CaledoniaNew ZealandNicaraguaNigerNigeriaNorth AmericaNorwayOECD membersOmanOther small statesPacific island small statesPakistanPalauPanamaPapua New GuineaParaguayPeruPhilippinesPolandPortugalPost-demographic dividendPre-demographic dividendPuerto RicoQatarRomaniaRussian FederationRwandaSamoaSan MarinoSao Tome and PrincipeSaudi ArabiaSenegalSerbiaSeychellesSierra LeoneSingaporeSlovak RepublicSloveniaSmall statesSolomon IslandsSomaliaSouth AfricaSouth AsiaSouth Asia (IDA & IBRD)South SudanSpainSri LankaSt. Kitts and NevisSt. LuciaSt. Vincent and the GrenadinesSub-Saharan Africa Sub-Saharan Africa (excluding high income)Sub-Saharan Africa (IDA & IBRD countries)SudanSurinameSwazilandSwedenSwitzerlandSyrian Arab RepublicTajikistanTanzaniaThailandTimor-LesteTogoTongaTrinidad and TobagoTunisiaTurkeyTurkmenistanTuvaluUgandaUkraineUnited Arab EmiratesUnited KingdomUnited StatesUpper middle incomeUruguayUzbekistanVanuatuVenezuela, RBVietnamVirgin Islands (U.S.)West Bank and GazaWorldYemen, Rep.ZambiaZimbabwe Timeline:
This timeline shows a graph from 1961 to 2016 of Luxembourg. No data until 1960. Number of actual observations by date: 56.
Source name:
World Development Indicators
Source organization:
World Bank national accounts data, and OECD National Accounts data files.
Categories, topics:
Economy & Growth, External Debt
Last updated:
apr 23, 2017
Indicators value changes by year
Minimum:
492.036 mln
jan 1, 1961
Maximum:
43.204 bln
jan 1, 2015
At the date of observation
Value
Absolute change
Change from previous value
jan 1, 1961
492.036 mln
+492.036 mln
0.0%
jan 1, 1962
493.161 mln
+1.125 mln
0.23%
jan 1, 1963
520.303 mln
+27.142 mln
5.5%
jan 1, 1964
555.509 mln
+35.206 mln
6.77%
jan 1, 1965
632.542 mln
+77.033 mln
13.87%
jan 1, 1966
646.031 mln
+13.49 mln
2.13%
jan 1, 1967
677.056 mln
+31.025 mln
4.8%
jan 1, 1968
682.466 mln
+5.409 mln
0.8%
jan 1, 1969
747.418 mln
+64.952 mln
9.52%
jan 1, 1970
866.872 mln
+119.454 mln
15.98%
jan 1, 1971
1.003 bln
+135.969 mln
15.69%
jan 1, 1972
1.049 bln
+46.63 mln
4.65%
jan 1, 1973
1.333 bln
+283.052 mln
26.97%
jan 1, 1974
1.814 bln
+481.142 mln
36.11%
jan 1, 1975
2.245 bln
+431.118 mln
23.77%
jan 1, 1976
2.36 bln
+115.574 mln
5.15%
jan 1, 1977
2.656 bln
+295.629 mln
12.52%
jan 1, 1978
2.997 bln
+340.664 mln
12.83%
jan 1, 1979
3.732 bln
+735.35 mln
24.54%
jan 1, 1980
4.364 bln
+631.732 mln
16.93%
jan 1, 1981
4.845 bln
+480.977 mln
11.02%
jan 1, 1982
4.227 bln
-617.732 mln
-12.75%
jan 1, 1983
4.218 bln
-8.561 mln
-0.2%
jan 1, 1984
4.25 bln
+32.064 mln
0.76%
jan 1, 1985
4.119 bln
-131.13 mln
-3.09%
jan 1, 1986
4.281 bln
+161.224 mln
3.91%
jan 1, 1987
6.098 bln
+1.817 bln
42.46%
jan 1, 1988
7.676 bln
+1.577 bln
25.87%
jan 1, 1989
8.522 bln
+846.883 mln
11.03%
jan 1, 1990
8.99 bln
+467.955 mln
5.49%
jan 1, 1991
11.626 bln
+2.635 bln
29.31%
jan 1, 1992
12.679 bln
+1.054 bln
9.06%
jan 1, 1993
14.148 bln
+1.469 bln
11.59%
jan 1, 1994
14.245 bln
+96.688 mln
0.68%
jan 1, 1995
15.253 bln
+1.009 bln
7.08%
jan 1, 1996
18.529 bln
+3.276 bln
21.47%
jan 1, 1997
18.541 bln
+12.241 mln
0.07%
jan 1, 1998
17.246 bln
-1.295 bln
-6.99%
jan 1, 1999
17.23 bln
-16.181 mln
-0.09%
jan 1, 2000
18.423 bln
+1.193 bln
6.92%
jan 1, 2001
17.093 bln
-1.331 bln
-7.22%
jan 1, 2002
17.255 bln
+162.354 mln
0.95%
jan 1, 2003
18.738 bln
+1.483 bln
8.6%
jan 1, 2004
22.674 bln
+3.936 bln
21.0%
jan 1, 2005
28.194 bln
+5.521 bln
24.35%
jan 1, 2006
30.953 bln
+2.758 bln
9.78%
jan 1, 2007
28.992 bln
-1.961 bln
-6.34%
jan 1, 2008
37.951 bln
+8.959 bln
30.9%
jan 1, 2009
41.22 bln
+3.269 bln
8.61%
jan 1, 2010
33.988 bln
-7.232 bln
-17.54%
jan 1, 2011
38.947 bln
+4.959 bln
14.59%
jan 1, 2012
40.864 bln
+1.917 bln
4.92%
jan 1, 2013
38.943 bln
-1.921 bln
-4.7%
jan 1, 2014
40.514 bln
+1.571 bln
4.03%
jan 1, 2015
43.204 bln
+2.69 bln
6.64%
jan 1, 2016
40.119 bln
-3.085 bln
-7.14%
Ranking of countries by current statistics by years


Comments: