29
/
en
AIzaSyAYiBZKx7MnpbEhh9jyipgxe19OcubqV5w
April 1, 2024
250795
St. Lucia
LCA
true
2
1
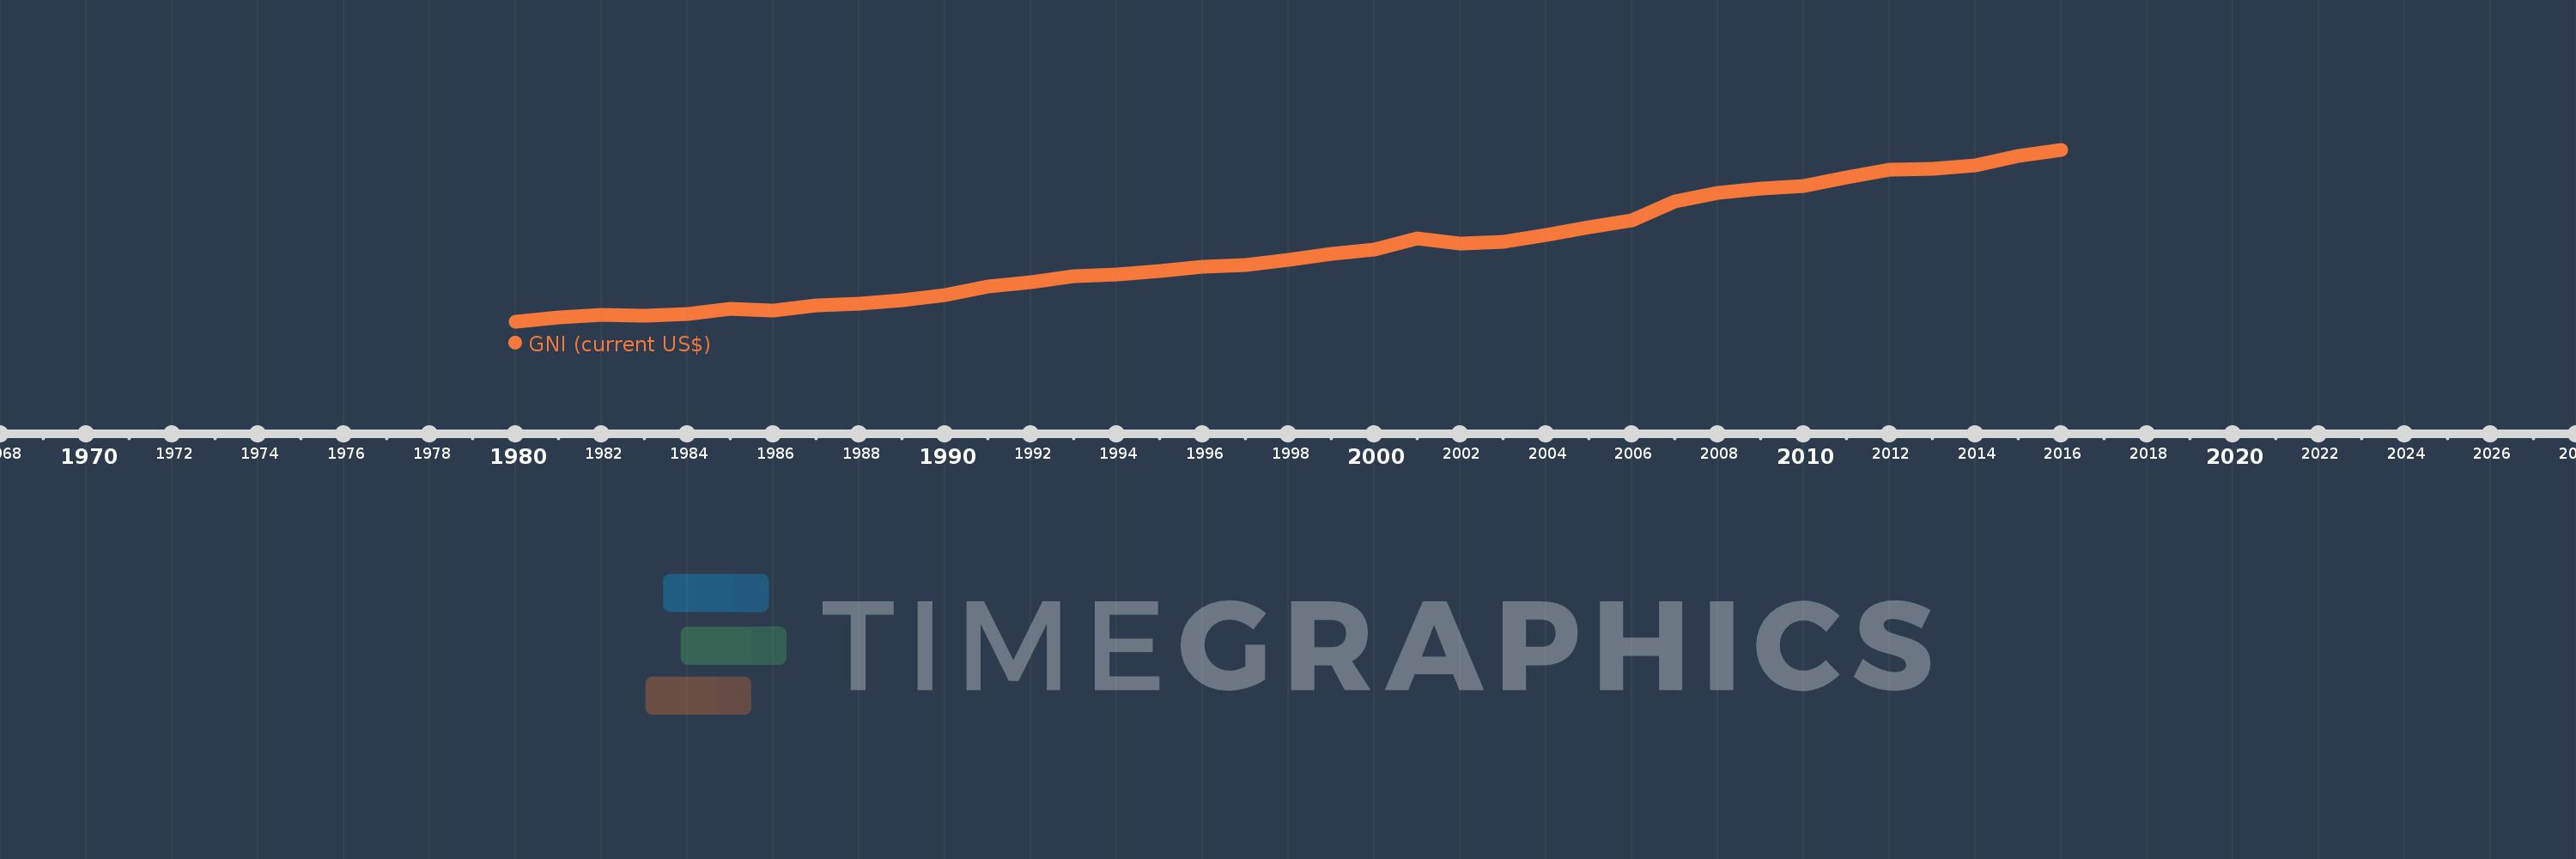
GNI (current US$)
2016,2015,2014,2013,2012,2011,2010,2009,2008,2007,2006,2005,2004,2003,2002,2001,2000,1999,1998,1997,1996,1995,1994,1993,1992,1991,1990,1989,1988,1987,1986,1985,1984,1983,1982,1981,1980
This statistics in other country:
AfghanistanAlbaniaAlgeriaAmerican SamoaAndorraAngolaAntigua and BarbudaArab WorldArgentinaArmeniaAustraliaAustriaAzerbaijanBahamas, TheBahrainBangladeshBarbadosBelarusBelgiumBelizeBeninBermudaBhutanBoliviaBosnia and HerzegovinaBotswanaBrazilBrunei DarussalamBulgariaBurkina FasoBurundiCabo VerdeCambodiaCameroonCanadaCaribbean small statesCentral African RepublicCentral Europe and the BalticsChadChannel IslandsChileChinaColombiaComorosCongo, Dem. Rep.Congo, Rep.Costa RicaCote d'IvoireCroatiaCubaCyprusCzech RepublicDenmarkDjiboutiDominicaDominican RepublicEarly-demographic dividendEast Asia & PacificEast Asia & Pacific (excluding high income)East Asia & Pacific (IDA & IBRD countries)EcuadorEgypt, Arab Rep.El SalvadorEquatorial GuineaEritreaEstoniaEthiopiaEuro areaEurope & Central AsiaEurope & Central Asia (excluding high income)Europe & Central Asia (IDA & IBRD countries)European UnionFaroe IslandsFijiFinlandFragile and conflict affected situationsFranceFrench PolynesiaGabonGambia, TheGeorgiaGermanyGhanaGreeceGreenlandGrenadaGuatemalaGuineaGuinea-BissauGuyanaHaitiHeavily indebted poor countries (HIPC)High incomeHondurasHong Kong SAR, ChinaHungaryIBRD onlyIcelandIDA & IBRD totalIDA blendIDA onlyIDA totalIndiaIndonesiaIran, Islamic Rep.IraqIrelandIsle of ManIsraelItalyJamaicaJapanJordanKazakhstanKenyaKiribatiKorea, Rep.KosovoKuwaitKyrgyz RepublicLao PDRLate-demographic dividendLatin America & Caribbean Latin America & Caribbean (excluding high income)Latin America & the Caribbean (IDA & IBRD countries)LatviaLeast developed countries: UN classificationLebanonLesothoLiberiaLibyaLiechtensteinLithuaniaLow & middle incomeLow incomeLower middle incomeLuxembourgMacao SAR, ChinaMacedonia, FYRMadagascarMalawiMalaysiaMaldivesMaliMaltaMarshall IslandsMauritaniaMauritiusMexicoMicronesia, Fed. Sts.Middle East & North AfricaMiddle East & North Africa (excluding high income)Middle East & North Africa (IDA & IBRD countries)Middle incomeMoldovaMonacoMongoliaMontenegroMoroccoMozambiqueMyanmarNamibiaNauruNepalNetherlandsNew CaledoniaNew ZealandNicaraguaNigerNigeriaNorth AmericaNorwayOECD membersOmanOther small statesPacific island small statesPakistanPalauPanamaPapua New GuineaParaguayPeruPhilippinesPolandPortugalPost-demographic dividendPre-demographic dividendPuerto RicoQatarRomaniaRussian FederationRwandaSamoaSan MarinoSao Tome and PrincipeSaudi ArabiaSenegalSerbiaSeychellesSierra LeoneSingaporeSlovak RepublicSloveniaSmall statesSolomon IslandsSomaliaSouth AfricaSouth AsiaSouth Asia (IDA & IBRD)South SudanSpainSri LankaSt. Kitts and NevisSt. LuciaSt. Vincent and the GrenadinesSub-Saharan Africa Sub-Saharan Africa (excluding high income)Sub-Saharan Africa (IDA & IBRD countries)SudanSurinameSwazilandSwedenSwitzerlandSyrian Arab RepublicTajikistanTanzaniaThailandTimor-LesteTogoTongaTrinidad and TobagoTunisiaTurkeyTurkmenistanTuvaluUgandaUkraineUnited Arab EmiratesUnited KingdomUnited StatesUpper middle incomeUruguayUzbekistanVanuatuVenezuela, RBVietnamVirgin Islands (U.S.)West Bank and GazaWorldYemen, Rep.ZambiaZimbabwe Timeline:
This timeline shows a graph from 1980 to 2016 of St. Lucia. No data until 1979. Number of actual observations by date: 37.
Source name:
World Development Indicators
Source organization:
World Bank national accounts data, and OECD National Accounts data files.
Categories, topics:
Economy & Growth, External Debt
Last updated:
apr 23, 2017
Indicators value changes by year
Minimum:
95.741 mln
jan 1, 1980
Maximum:
1.409 bln
jan 1, 2016
At the date of observation
Value
Absolute change
Change from previous value
jan 1, 1980
95.741 mln
+95.741 mln
0.0%
jan 1, 1981
131.23 mln
+35.489 mln
37.07%
jan 1, 1982
149.837 mln
+18.607 mln
14.18%
jan 1, 1983
142.404 mln
-7.433 mln
-4.96%
jan 1, 1984
153.911 mln
+11.507 mln
8.08%
jan 1, 1985
194.274 mln
+40.363 mln
26.22%
jan 1, 1986
186.167 mln
-8.107 mln
-4.17%
jan 1, 1987
220.963 mln
+34.796 mln
18.69%
jan 1, 1988
237.348 mln
+16.385 mln
7.42%
jan 1, 1989
262.644 mln
+25.296 mln
10.66%
jan 1, 1990
300.474 mln
+37.83 mln
14.4%
jan 1, 1991
369.23 mln
+68.756 mln
22.88%
jan 1, 1992
398.841 mln
+29.611 mln
8.02%
jan 1, 1993
447.589 mln
+48.748 mln
12.22%
jan 1, 1994
457.13 mln
+9.541 mln
2.13%
jan 1, 1995
483.967 mln
+26.837 mln
5.87%
jan 1, 1996
521.211 mln
+37.244 mln
7.7%
jan 1, 1997
530.364 mln
+9.153 mln
1.76%
jan 1, 1998
568.359 mln
+37.995 mln
7.16%
jan 1, 1999
615.233 mln
+46.874 mln
8.25%
jan 1, 2000
650.585 mln
+35.352 mln
5.75%
jan 1, 2001
736.295 mln
+85.71 mln
13.17%
jan 1, 2002
695.399 mln
-40.896 mln
-5.55%
jan 1, 2003
709.727 mln
+14.328 mln
2.06%
jan 1, 2004
759.257 mln
+49.53 mln
6.98%
jan 1, 2005
821.767 mln
+62.511 mln
8.23%
jan 1, 2006
874.171 mln
+52.404 mln
6.38%
jan 1, 2007
1.02 bln
+146.045 mln
16.71%
jan 1, 2008
1.083 bln
+62.334 mln
6.11%
jan 1, 2009
1.115 bln
+32.652 mln
3.02%
jan 1, 2010
1.136 bln
+20.588 mln
1.85%
jan 1, 2011
1.202 bln
+66.535 mln
5.86%
jan 1, 2012
1.261 bln
+58.338 mln
4.85%
jan 1, 2013
1.265 bln
+4.565 mln
0.36%
jan 1, 2014
1.295 bln
+29.943 mln
2.37%
jan 1, 2015
1.363 bln
+68.321 mln
5.28%
jan 1, 2016
1.409 bln
+45.689 mln
3.35%
Ranking of countries by current statistics by years


Comments: