29
/
en
AIzaSyAYiBZKx7MnpbEhh9jyipgxe19OcubqV5w
April 1, 2024
208724
New Caledonia
NCL
true
2
1
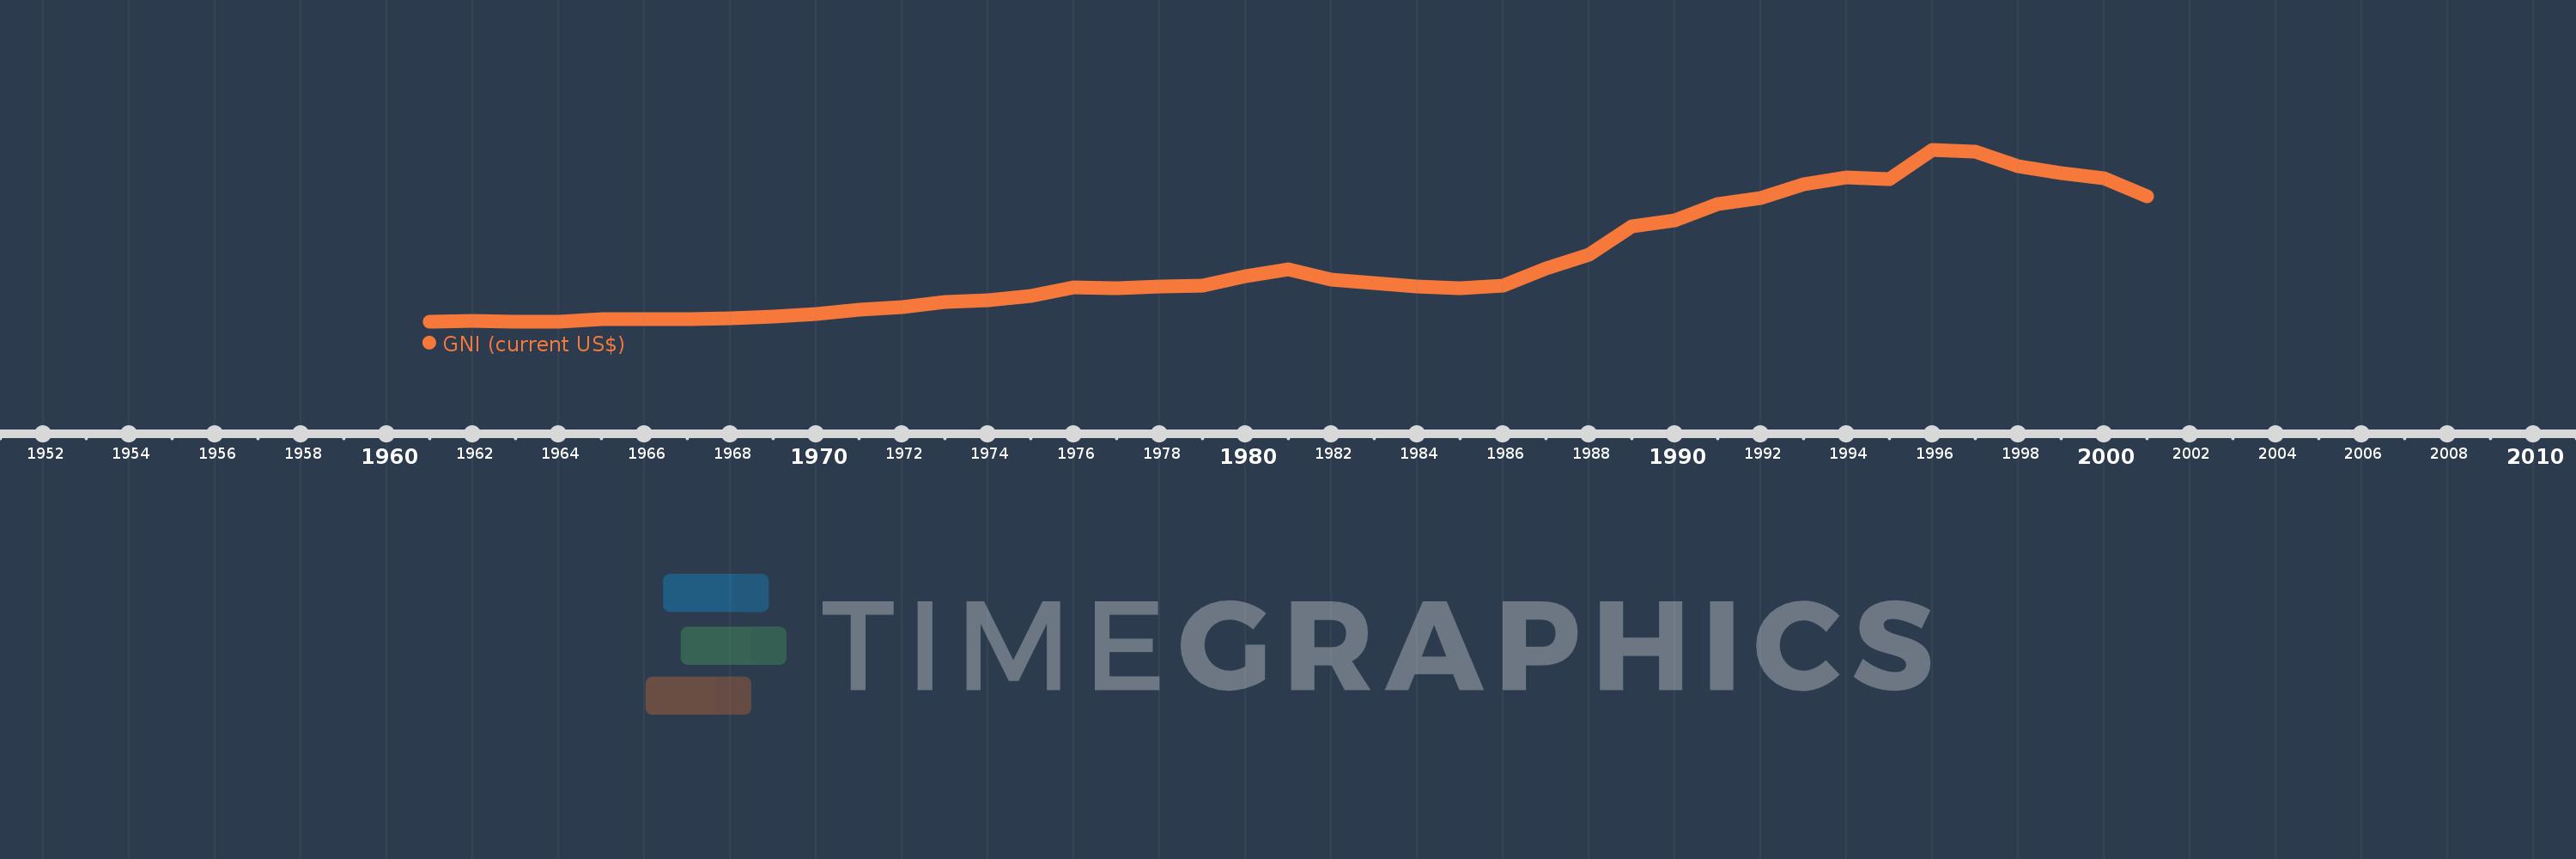
GNI (current US$)
2001,2000,1999,1998,1997,1996,1995,1994,1993,1992,1991,1990,1989,1988,1987,1986,1985,1984,1983,1982,1981,1980,1979,1978,1977,1976,1975,1974,1973,1972,1971,1970,1969,1968,1967,1966,1965,1964,1963,1962,1961
This statistics in other country:
AfghanistanAlbaniaAlgeriaAmerican SamoaAndorraAngolaAntigua and BarbudaArab WorldArgentinaArmeniaAustraliaAustriaAzerbaijanBahamas, TheBahrainBangladeshBarbadosBelarusBelgiumBelizeBeninBermudaBhutanBoliviaBosnia and HerzegovinaBotswanaBrazilBrunei DarussalamBulgariaBurkina FasoBurundiCabo VerdeCambodiaCameroonCanadaCaribbean small statesCentral African RepublicCentral Europe and the BalticsChadChannel IslandsChileChinaColombiaComorosCongo, Dem. Rep.Congo, Rep.Costa RicaCote d'IvoireCroatiaCubaCyprusCzech RepublicDenmarkDjiboutiDominicaDominican RepublicEarly-demographic dividendEast Asia & PacificEast Asia & Pacific (excluding high income)East Asia & Pacific (IDA & IBRD countries)EcuadorEgypt, Arab Rep.El SalvadorEquatorial GuineaEritreaEstoniaEthiopiaEuro areaEurope & Central AsiaEurope & Central Asia (excluding high income)Europe & Central Asia (IDA & IBRD countries)European UnionFaroe IslandsFijiFinlandFragile and conflict affected situationsFranceFrench PolynesiaGabonGambia, TheGeorgiaGermanyGhanaGreeceGreenlandGrenadaGuatemalaGuineaGuinea-BissauGuyanaHaitiHeavily indebted poor countries (HIPC)High incomeHondurasHong Kong SAR, ChinaHungaryIBRD onlyIcelandIDA & IBRD totalIDA blendIDA onlyIDA totalIndiaIndonesiaIran, Islamic Rep.IraqIrelandIsle of ManIsraelItalyJamaicaJapanJordanKazakhstanKenyaKiribatiKorea, Rep.KosovoKuwaitKyrgyz RepublicLao PDRLate-demographic dividendLatin America & Caribbean Latin America & Caribbean (excluding high income)Latin America & the Caribbean (IDA & IBRD countries)LatviaLeast developed countries: UN classificationLebanonLesothoLiberiaLibyaLiechtensteinLithuaniaLow & middle incomeLow incomeLower middle incomeLuxembourgMacao SAR, ChinaMacedonia, FYRMadagascarMalawiMalaysiaMaldivesMaliMaltaMarshall IslandsMauritaniaMauritiusMexicoMicronesia, Fed. Sts.Middle East & North AfricaMiddle East & North Africa (excluding high income)Middle East & North Africa (IDA & IBRD countries)Middle incomeMoldovaMonacoMongoliaMontenegroMoroccoMozambiqueMyanmarNamibiaNauruNepalNetherlandsNew CaledoniaNew ZealandNicaraguaNigerNigeriaNorth AmericaNorwayOECD membersOmanOther small statesPacific island small statesPakistanPalauPanamaPapua New GuineaParaguayPeruPhilippinesPolandPortugalPost-demographic dividendPre-demographic dividendPuerto RicoQatarRomaniaRussian FederationRwandaSamoaSan MarinoSao Tome and PrincipeSaudi ArabiaSenegalSerbiaSeychellesSierra LeoneSingaporeSlovak RepublicSloveniaSmall statesSolomon IslandsSomaliaSouth AfricaSouth AsiaSouth Asia (IDA & IBRD)South SudanSpainSri LankaSt. Kitts and NevisSt. LuciaSt. Vincent and the GrenadinesSub-Saharan Africa Sub-Saharan Africa (excluding high income)Sub-Saharan Africa (IDA & IBRD countries)SudanSurinameSwazilandSwedenSwitzerlandSyrian Arab RepublicTajikistanTanzaniaThailandTimor-LesteTogoTongaTrinidad and TobagoTunisiaTurkeyTurkmenistanTuvaluUgandaUkraineUnited Arab EmiratesUnited KingdomUnited StatesUpper middle incomeUruguayUzbekistanVanuatuVenezuela, RBVietnamVirgin Islands (U.S.)West Bank and GazaWorldYemen, Rep.ZambiaZimbabwe Timeline:
This timeline shows a graph from 1961 to 2001 of New Caledonia. No data until 1960. Number of actual observations by date: 41.
Source name:
World Development Indicators
Source organization:
World Bank national accounts data, and OECD National Accounts data files.
Categories, topics:
Economy & Growth, External Debt
Last updated:
apr 23, 2017
Indicators value changes by year
Minimum:
100.863 mln
jan 1, 1963
Maximum:
3.628 bln
jan 1, 1996
At the date of observation
Value
Absolute change
Change from previous value
jan 1, 1961
103.537 mln
+103.537 mln
0.0%
jan 1, 1962
117.507 mln
+13.97 mln
13.49%
jan 1, 1963
100.863 mln
-16.643 mln
-14.16%
jan 1, 1964
112.85 mln
+11.987 mln
11.88%
jan 1, 1965
164.207 mln
+51.356 mln
45.51%
jan 1, 1966
159.594 mln
-4.612 mln
-2.81%
jan 1, 1967
164.207 mln
+4.612 mln
2.89%
jan 1, 1968
180.037 mln
+15.83 mln
9.64%
jan 1, 1969
215.507 mln
+35.47 mln
19.7%
jan 1, 1970
263.109 mln
+47.602 mln
22.09%
jan 1, 1971
358.816 mln
+95.707 mln
36.38%
jan 1, 1972
413.634 mln
+54.819 mln
15.28%
jan 1, 1973
505.893 mln
+92.258 mln
22.3%
jan 1, 1974
542.295 mln
+36.402 mln
7.2%
jan 1, 1975
637.4 mln
+95.105 mln
17.54%
jan 1, 1976
816.648 mln
+179.248 mln
28.12%
jan 1, 1977
798.311 mln
-18.337 mln
-2.25%
jan 1, 1978
837.617 mln
+39.306 mln
4.92%
jan 1, 1979
846.008 mln
+8.391 mln
1.0%
jan 1, 1980
1.047 bln
+201.218 mln
23.78%
jan 1, 1981
1.182 bln
+135.232 mln
12.91%
jan 1, 1982
972.564 mln
-209.893 mln
-17.75%
jan 1, 1983
904.62 mln
-67.944 mln
-6.99%
jan 1, 1984
823.833 mln
-80.787 mln
-8.93%
jan 1, 1985
796.019 mln
-27.814 mln
-3.38%
jan 1, 1986
854.824 mln
+58.805 mln
7.39%
jan 1, 1987
1.201 bln
+346.439 mln
40.53%
jan 1, 1988
1.488 bln
+286.851 mln
23.88%
jan 1, 1989
2.073 bln
+584.622 mln
39.29%
jan 1, 1990
2.185 bln
+112.337 mln
5.42%
jan 1, 1991
2.529 bln
+344.237 mln
15.75%
jan 1, 1992
2.654 bln
+124.471 mln
4.92%
jan 1, 1993
2.924 bln
+269.983 mln
10.17%
jan 1, 1994
3.07 bln
+146.397 mln
5.01%
jan 1, 1995
3.039 bln
-31.434 mln
-1.02%
jan 1, 1996
3.628 bln
+589.713 mln
19.41%
jan 1, 1997
3.607 bln
-21.472 mln
-0.59%
jan 1, 1998
3.291 bln
-315.479 mln
-8.75%
jan 1, 1999
3.159 bln
-132.683 mln
-4.03%
jan 1, 2000
3.057 bln
-101.806 mln
-3.22%
jan 1, 2001
2.682 bln
-374.653 mln
-12.26%
Ranking of countries by current statistics by years


Comments: