29
/
en
AIzaSyAYiBZKx7MnpbEhh9jyipgxe19OcubqV5w
April 1, 2024
248733
Sri Lanka
LKA
true
2
1
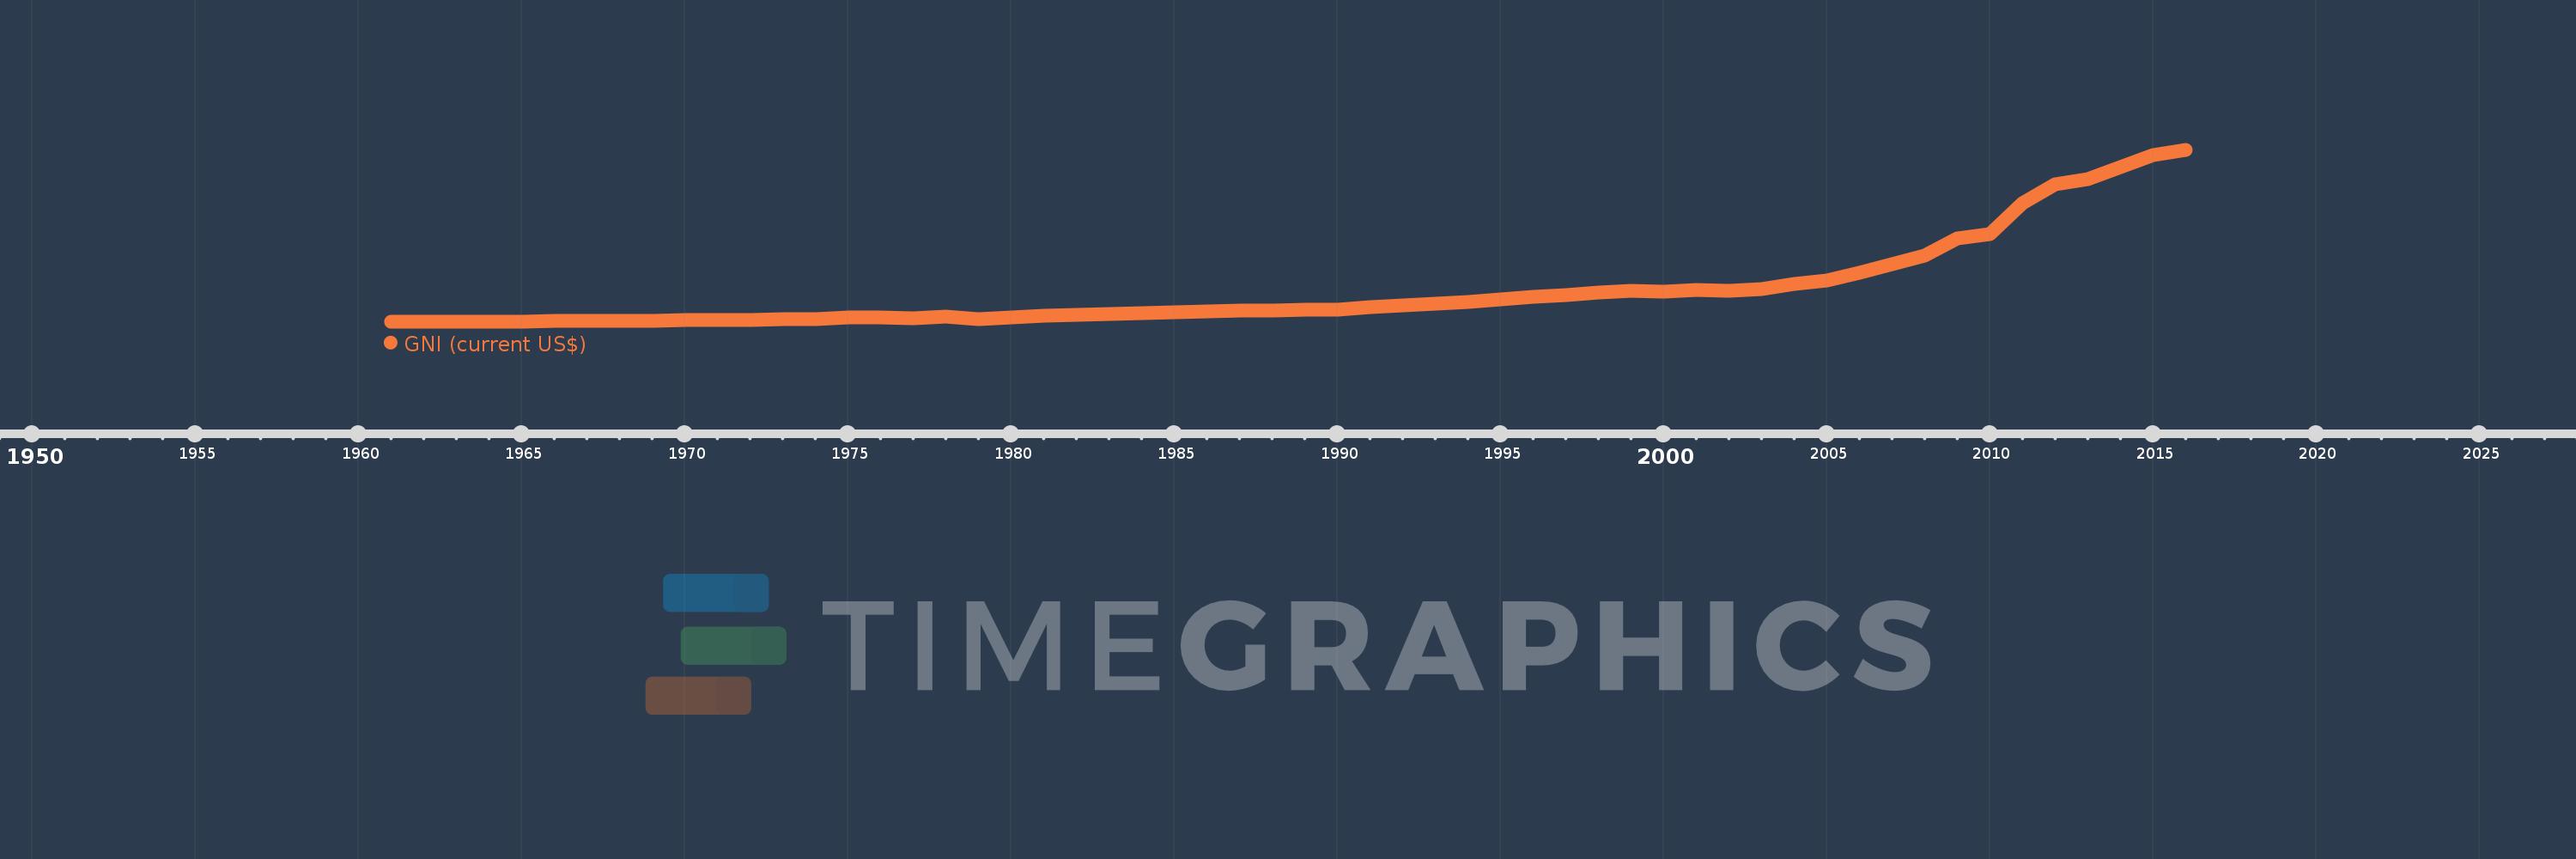
GNI (current US$)
2016,2015,2014,2013,2012,2011,2010,2009,2008,2007,2006,2005,2004,2003,2002,2001,2000,1999,1998,1997,1996,1995,1994,1993,1992,1991,1990,1989,1988,1987,1986,1985,1984,1983,1982,1981,1980,1979,1978,1977,1976,1975,1974,1973,1972,1971,1970,1969,1968,1967,1966,1965,1964,1963,1962,1961
This statistics in other country:
AfghanistanAlbaniaAlgeriaAmerican SamoaAndorraAngolaAntigua and BarbudaArab WorldArgentinaArmeniaAustraliaAustriaAzerbaijanBahamas, TheBahrainBangladeshBarbadosBelarusBelgiumBelizeBeninBermudaBhutanBoliviaBosnia and HerzegovinaBotswanaBrazilBrunei DarussalamBulgariaBurkina FasoBurundiCabo VerdeCambodiaCameroonCanadaCaribbean small statesCentral African RepublicCentral Europe and the BalticsChadChannel IslandsChileChinaColombiaComorosCongo, Dem. Rep.Congo, Rep.Costa RicaCote d'IvoireCroatiaCubaCyprusCzech RepublicDenmarkDjiboutiDominicaDominican RepublicEarly-demographic dividendEast Asia & PacificEast Asia & Pacific (excluding high income)East Asia & Pacific (IDA & IBRD countries)EcuadorEgypt, Arab Rep.El SalvadorEquatorial GuineaEritreaEstoniaEthiopiaEuro areaEurope & Central AsiaEurope & Central Asia (excluding high income)Europe & Central Asia (IDA & IBRD countries)European UnionFaroe IslandsFijiFinlandFragile and conflict affected situationsFranceFrench PolynesiaGabonGambia, TheGeorgiaGermanyGhanaGreeceGreenlandGrenadaGuatemalaGuineaGuinea-BissauGuyanaHaitiHeavily indebted poor countries (HIPC)High incomeHondurasHong Kong SAR, ChinaHungaryIBRD onlyIcelandIDA & IBRD totalIDA blendIDA onlyIDA totalIndiaIndonesiaIran, Islamic Rep.IraqIrelandIsle of ManIsraelItalyJamaicaJapanJordanKazakhstanKenyaKiribatiKorea, Rep.KosovoKuwaitKyrgyz RepublicLao PDRLate-demographic dividendLatin America & Caribbean Latin America & Caribbean (excluding high income)Latin America & the Caribbean (IDA & IBRD countries)LatviaLeast developed countries: UN classificationLebanonLesothoLiberiaLibyaLiechtensteinLithuaniaLow & middle incomeLow incomeLower middle incomeLuxembourgMacao SAR, ChinaMacedonia, FYRMadagascarMalawiMalaysiaMaldivesMaliMaltaMarshall IslandsMauritaniaMauritiusMexicoMicronesia, Fed. Sts.Middle East & North AfricaMiddle East & North Africa (excluding high income)Middle East & North Africa (IDA & IBRD countries)Middle incomeMoldovaMonacoMongoliaMontenegroMoroccoMozambiqueMyanmarNamibiaNauruNepalNetherlandsNew CaledoniaNew ZealandNicaraguaNigerNigeriaNorth AmericaNorwayOECD membersOmanOther small statesPacific island small statesPakistanPalauPanamaPapua New GuineaParaguayPeruPhilippinesPolandPortugalPost-demographic dividendPre-demographic dividendPuerto RicoQatarRomaniaRussian FederationRwandaSamoaSan MarinoSao Tome and PrincipeSaudi ArabiaSenegalSerbiaSeychellesSierra LeoneSingaporeSlovak RepublicSloveniaSmall statesSolomon IslandsSomaliaSouth AfricaSouth AsiaSouth Asia (IDA & IBRD)South SudanSpainSri LankaSt. Kitts and NevisSt. LuciaSt. Vincent and the GrenadinesSub-Saharan Africa Sub-Saharan Africa (excluding high income)Sub-Saharan Africa (IDA & IBRD countries)SudanSurinameSwazilandSwedenSwitzerlandSyrian Arab RepublicTajikistanTanzaniaThailandTimor-LesteTogoTongaTrinidad and TobagoTunisiaTurkeyTurkmenistanTuvaluUgandaUkraineUnited Arab EmiratesUnited KingdomUnited StatesUpper middle incomeUruguayUzbekistanVanuatuVenezuela, RBVietnamVirgin Islands (U.S.)West Bank and GazaWorldYemen, Rep.ZambiaZimbabwe Timeline:
This timeline shows a graph from 1961 to 2016 of Sri Lanka. No data until 1960. Number of actual observations by date: 56.
Source name:
World Development Indicators
Source organization:
World Bank national accounts data, and OECD National Accounts data files.
Categories, topics:
Economy & Growth, External Debt
Last updated:
apr 23, 2017
Indicators value changes by year
Minimum:
1.224 bln
jan 1, 1964
Maximum:
80.467 bln
jan 1, 2016
At the date of observation
Value
Absolute change
Change from previous value
jan 1, 1961
1.406 bln
+1.406 bln
0.0%
jan 1, 1962
1.407 bln
+593.971K
0.04%
jan 1, 1963
1.439 bln
+31.741 mln
2.26%
jan 1, 1964
1.224 bln
-214.949 mln
-14.94%
jan 1, 1965
1.307 bln
+82.834 mln
6.77%
jan 1, 1966
1.683 bln
+376.751 mln
28.83%
jan 1, 1967
1.751 bln
+67.227 mln
3.99%
jan 1, 1968
1.856 bln
+104.925 mln
5.99%
jan 1, 1969
1.771 bln
-84.295 mln
-4.54%
jan 1, 1970
1.954 bln
+182.353 mln
10.3%
jan 1, 1971
2.142 bln
+188.571 mln
9.65%
jan 1, 1972
2.158 bln
+15.994 mln
0.75%
jan 1, 1973
2.352 bln
+193.915 mln
8.99%
jan 1, 1974
2.623 bln
+270.406 mln
11.5%
jan 1, 1975
3.23 bln
+607.876 mln
23.18%
jan 1, 1976
3.369 bln
+138.954 mln
4.3%
jan 1, 1977
3.056 bln
-312.968 mln
-9.29%
jan 1, 1978
3.524 bln
+467.427 mln
15.29%
jan 1, 1979
2.501 bln
-1.023 bln
-29.02%
jan 1, 1980
3.358 bln
+857.164 mln
34.27%
jan 1, 1981
4.067 bln
+708.705 mln
21.1%
jan 1, 1982
4.392 bln
+324.538 mln
7.98%
jan 1, 1983
4.818 bln
+426.092 mln
9.7%
jan 1, 1984
5.141 bln
+323.699 mln
6.72%
jan 1, 1985
5.871 bln
+729.472 mln
14.19%
jan 1, 1986
5.953 bln
+82.436 mln
1.4%
jan 1, 1987
6.378 bln
+425.057 mln
7.14%
jan 1, 1988
6.654 bln
+275.191 mln
4.31%
jan 1, 1989
6.961 bln
+307.541 mln
4.62%
jan 1, 1990
6.936 bln
-24.699 mln
-0.35%
jan 1, 1991
7.974 bln
+1.037 bln
14.95%
jan 1, 1992
8.926 bln
+952.3 mln
11.94%
jan 1, 1993
9.681 bln
+755.041 mln
8.46%
jan 1, 1994
10.34 bln
+658.979 mln
6.81%
jan 1, 1995
11.646 bln
+1.306 bln
12.63%
jan 1, 1996
12.86 bln
+1.214 bln
10.42%
jan 1, 1997
13.702 bln
+842.279 mln
6.55%
jan 1, 1998
14.918 bln
+1.216 bln
8.87%
jan 1, 1999
15.545 bln
+627.873 mln
4.21%
jan 1, 2000
15.373 bln
-172.38 mln
-1.11%
jan 1, 2001
16.016 bln
+643.126 mln
4.18%
jan 1, 2002
15.465 bln
-551.592 mln
-3.44%
jan 1, 2003
16.285 bln
+820.659 mln
5.31%
jan 1, 2004
18.71 bln
+2.425 bln
14.89%
jan 1, 2005
20.458 bln
+1.747 bln
9.34%
jan 1, 2006
24.107 bln
+3.65 bln
17.84%
jan 1, 2007
27.891 bln
+3.784 bln
15.69%
jan 1, 2008
31.997 bln
+4.106 bln
14.72%
jan 1, 2009
39.744 bln
+7.747 bln
24.21%
jan 1, 2010
41.581 bln
+1.837 bln
4.62%
jan 1, 2011
56.109 bln
+14.528 bln
34.94%
jan 1, 2012
64.641 bln
+8.533 bln
15.21%
jan 1, 2013
67.221 bln
+2.579 bln
3.99%
jan 1, 2014
72.566 bln
+5.346 bln
7.95%
jan 1, 2015
78.213 bln
+5.647 bln
7.78%
jan 1, 2016
80.467 bln
+2.254 bln
2.88%
Ranking of countries by current statistics by years


Comments: