29
/
en
AIzaSyAYiBZKx7MnpbEhh9jyipgxe19OcubqV5w
April 1, 2024
238277
Seychelles
SYC
true
2
1
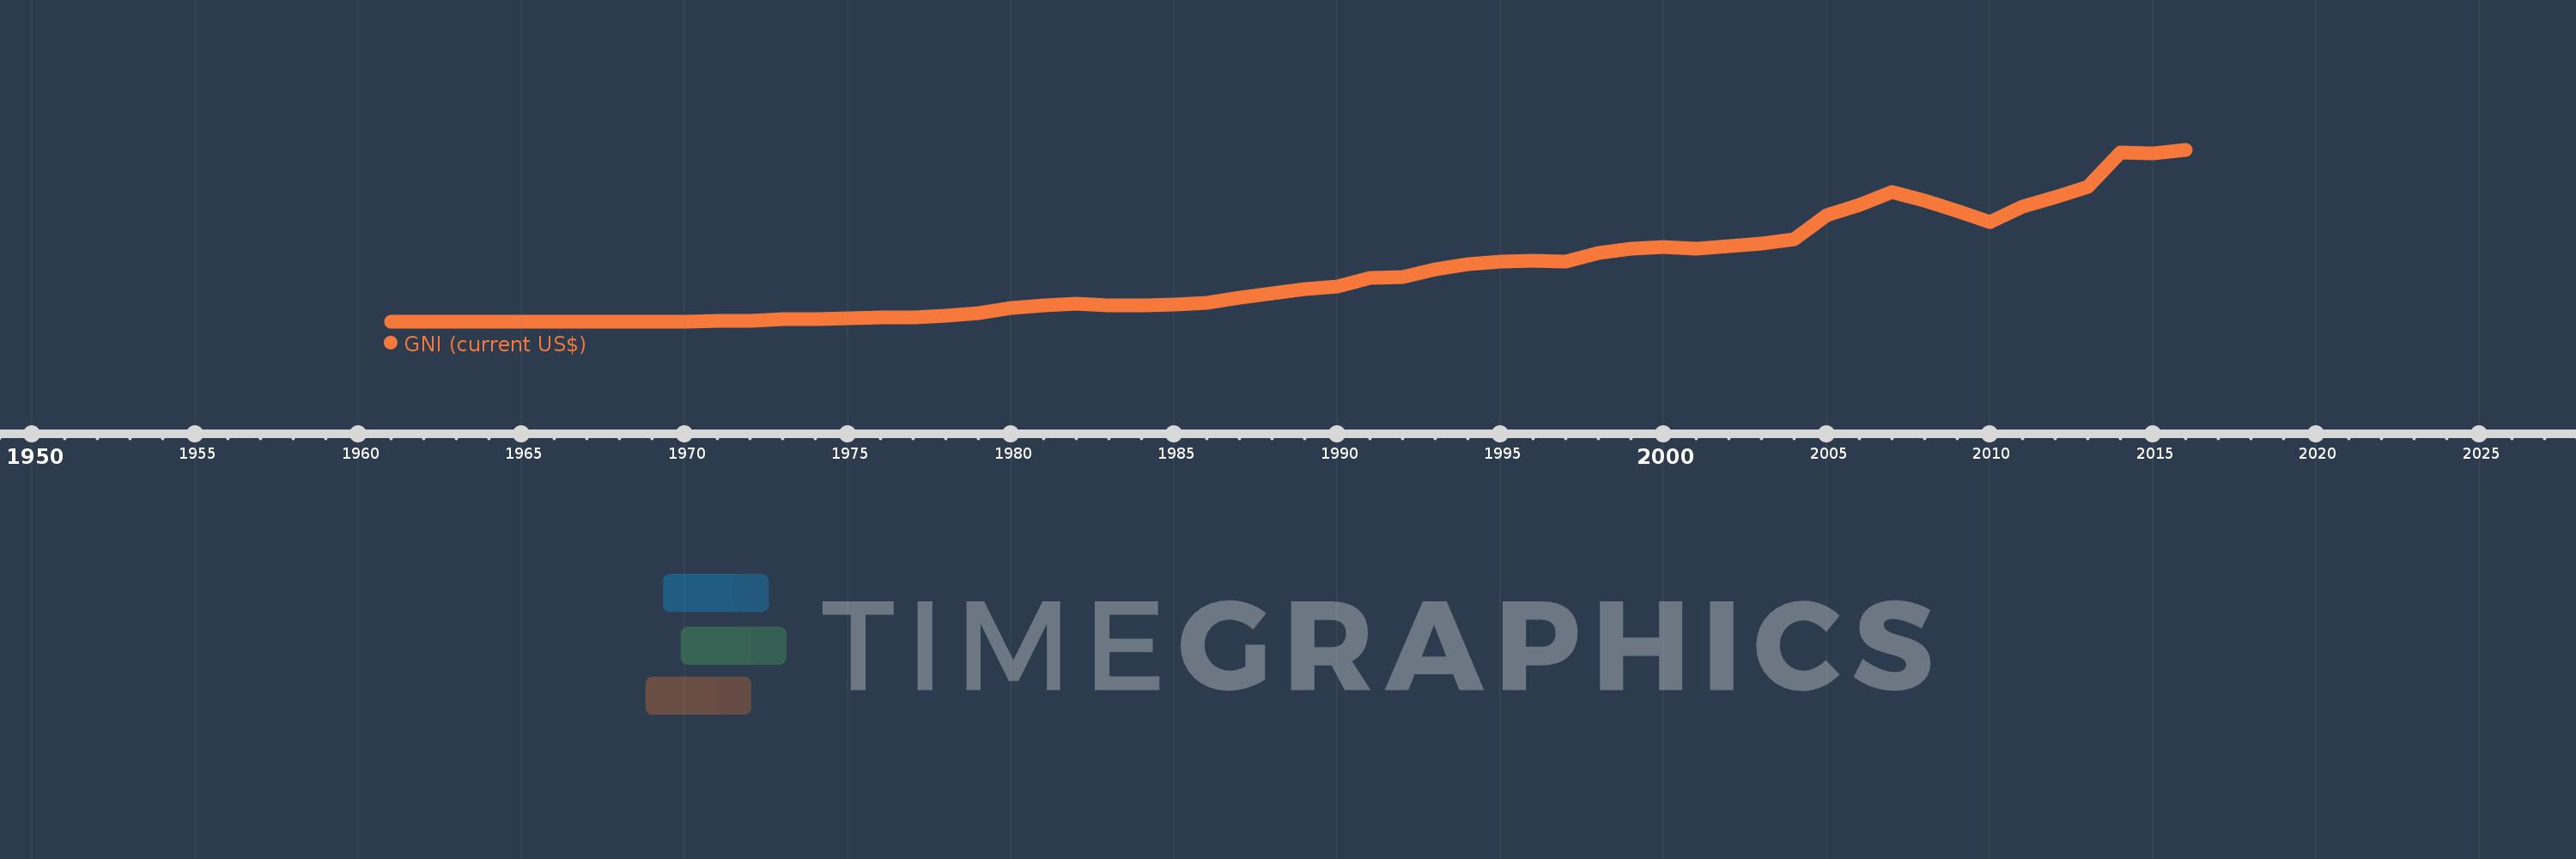
GNI (current US$)
2016,2015,2014,2013,2012,2011,2010,2009,2008,2007,2006,2005,2004,2003,2002,2001,2000,1999,1998,1997,1996,1995,1994,1993,1992,1991,1990,1989,1988,1987,1986,1985,1984,1983,1982,1981,1980,1979,1978,1977,1976,1975,1974,1973,1972,1971,1970,1969,1968,1967,1966,1965,1964,1963,1962,1961
This statistics in other country:
AfghanistanAlbaniaAlgeriaAmerican SamoaAndorraAngolaAntigua and BarbudaArab WorldArgentinaArmeniaAustraliaAustriaAzerbaijanBahamas, TheBahrainBangladeshBarbadosBelarusBelgiumBelizeBeninBermudaBhutanBoliviaBosnia and HerzegovinaBotswanaBrazilBrunei DarussalamBulgariaBurkina FasoBurundiCabo VerdeCambodiaCameroonCanadaCaribbean small statesCentral African RepublicCentral Europe and the BalticsChadChannel IslandsChileChinaColombiaComorosCongo, Dem. Rep.Congo, Rep.Costa RicaCote d'IvoireCroatiaCubaCyprusCzech RepublicDenmarkDjiboutiDominicaDominican RepublicEarly-demographic dividendEast Asia & PacificEast Asia & Pacific (excluding high income)East Asia & Pacific (IDA & IBRD countries)EcuadorEgypt, Arab Rep.El SalvadorEquatorial GuineaEritreaEstoniaEthiopiaEuro areaEurope & Central AsiaEurope & Central Asia (excluding high income)Europe & Central Asia (IDA & IBRD countries)European UnionFaroe IslandsFijiFinlandFragile and conflict affected situationsFranceFrench PolynesiaGabonGambia, TheGeorgiaGermanyGhanaGreeceGreenlandGrenadaGuatemalaGuineaGuinea-BissauGuyanaHaitiHeavily indebted poor countries (HIPC)High incomeHondurasHong Kong SAR, ChinaHungaryIBRD onlyIcelandIDA & IBRD totalIDA blendIDA onlyIDA totalIndiaIndonesiaIran, Islamic Rep.IraqIrelandIsle of ManIsraelItalyJamaicaJapanJordanKazakhstanKenyaKiribatiKorea, Rep.KosovoKuwaitKyrgyz RepublicLao PDRLate-demographic dividendLatin America & Caribbean Latin America & Caribbean (excluding high income)Latin America & the Caribbean (IDA & IBRD countries)LatviaLeast developed countries: UN classificationLebanonLesothoLiberiaLibyaLiechtensteinLithuaniaLow & middle incomeLow incomeLower middle incomeLuxembourgMacao SAR, ChinaMacedonia, FYRMadagascarMalawiMalaysiaMaldivesMaliMaltaMarshall IslandsMauritaniaMauritiusMexicoMicronesia, Fed. Sts.Middle East & North AfricaMiddle East & North Africa (excluding high income)Middle East & North Africa (IDA & IBRD countries)Middle incomeMoldovaMonacoMongoliaMontenegroMoroccoMozambiqueMyanmarNamibiaNauruNepalNetherlandsNew CaledoniaNew ZealandNicaraguaNigerNigeriaNorth AmericaNorwayOECD membersOmanOther small statesPacific island small statesPakistanPalauPanamaPapua New GuineaParaguayPeruPhilippinesPolandPortugalPost-demographic dividendPre-demographic dividendPuerto RicoQatarRomaniaRussian FederationRwandaSamoaSan MarinoSao Tome and PrincipeSaudi ArabiaSenegalSerbiaSeychellesSierra LeoneSingaporeSlovak RepublicSloveniaSmall statesSolomon IslandsSomaliaSouth AfricaSouth AsiaSouth Asia (IDA & IBRD)South SudanSpainSri LankaSt. Kitts and NevisSt. LuciaSt. Vincent and the GrenadinesSub-Saharan Africa Sub-Saharan Africa (excluding high income)Sub-Saharan Africa (IDA & IBRD countries)SudanSurinameSwazilandSwedenSwitzerlandSyrian Arab RepublicTajikistanTanzaniaThailandTimor-LesteTogoTongaTrinidad and TobagoTunisiaTurkeyTurkmenistanTuvaluUgandaUkraineUnited Arab EmiratesUnited KingdomUnited StatesUpper middle incomeUruguayUzbekistanVanuatuVenezuela, RBVietnamVirgin Islands (U.S.)West Bank and GazaWorldYemen, Rep.ZambiaZimbabwe Timeline:
This timeline shows a graph from 1961 to 2016 of Seychelles. No data until 1960. Number of actual observations by date: 56.
Source name:
World Development Indicators
Source organization:
World Bank national accounts data, and OECD National Accounts data files.
Categories, topics:
Economy & Growth, External Debt
Last updated:
apr 23, 2017
Indicators value changes by year
Minimum:
11.55 mln
jan 1, 1962
Maximum:
1.358 bln
jan 1, 2016
At the date of observation
Value
Absolute change
Change from previous value
jan 1, 1961
11.97 mln
+11.97 mln
0.0%
jan 1, 1962
11.55 mln
-420.001K
-3.51%
jan 1, 1963
12.6 mln
+1.05 mln
9.09%
jan 1, 1964
13.86 mln
+1.26 mln
10.0%
jan 1, 1965
15.33 mln
+1.47 mln
10.61%
jan 1, 1966
15.54 mln
+210.0K
1.37%
jan 1, 1967
16.38 mln
+840.002K
5.41%
jan 1, 1968
16.57 mln
+189.861K
1.16%
jan 1, 1969
16.02 mln
-549.868K
-3.32%
jan 1, 1970
16.38 mln
+360.001K
2.25%
jan 1, 1971
18.36 mln
+1.98 mln
12.09%
jan 1, 1972
21.875 mln
+3.515 mln
19.14%
jan 1, 1973
30.533 mln
+8.658 mln
39.58%
jan 1, 1974
36.749 mln
+6.217 mln
20.36%
jan 1, 1975
42.959 mln
+6.21 mln
16.9%
jan 1, 1976
47.621 mln
+4.661 mln
10.85%
jan 1, 1977
47.149 mln
-471.349K
-0.99%
jan 1, 1978
60.654 mln
+13.504 mln
28.64%
jan 1, 1979
80.044 mln
+19.39 mln
31.97%
jan 1, 1980
118.371 mln
+38.327 mln
47.88%
jan 1, 1981
142.022 mln
+23.652 mln
19.98%
jan 1, 1982
152.591 mln
+10.568 mln
7.44%
jan 1, 1983
143.883 mln
-8.708 mln
-5.71%
jan 1, 1984
141.896 mln
-1.987 mln
-1.38%
jan 1, 1985
145.477 mln
+3.581 mln
2.52%
jan 1, 1986
162.972 mln
+17.496 mln
12.03%
jan 1, 1987
199.367 mln
+36.395 mln
22.33%
jan 1, 1988
235.303 mln
+35.936 mln
18.02%
jan 1, 1989
266.443 mln
+31.14 mln
13.23%
jan 1, 1990
289.919 mln
+23.476 mln
8.81%
jan 1, 1991
355.431 mln
+65.512 mln
22.6%
jan 1, 1992
363.564 mln
+8.133 mln
2.29%
jan 1, 1993
424.374 mln
+60.81 mln
16.73%
jan 1, 1994
463.071 mln
+38.697 mln
9.12%
jan 1, 1995
482.594 mln
+19.524 mln
4.22%
jan 1, 1996
488.586 mln
+5.992 mln
1.24%
jan 1, 1997
488.038 mln
-548.5K
-0.11%
jan 1, 1998
550.703 mln
+62.665 mln
12.84%
jan 1, 1999
587.408 mln
+36.705 mln
6.67%
jan 1, 2000
598.128 mln
+10.72 mln
1.82%
jan 1, 2001
583.246 mln
-14.882 mln
-2.49%
jan 1, 2002
604.826 mln
+21.58 mln
3.7%
jan 1, 2003
629.509 mln
+24.683 mln
4.08%
jan 1, 2004
662.711 mln
+33.202 mln
5.27%
jan 1, 2005
848.757 mln
+186.046 mln
28.07%
jan 1, 2006
928.912 mln
+80.155 mln
9.44%
jan 1, 2007
1.027 bln
+97.857 mln
10.53%
jan 1, 2008
961.671 mln
-65.098 mln
-6.34%
jan 1, 2009
884.729 mln
-76.942 mln
-8.0%
jan 1, 2010
791.821 mln
-92.908 mln
-10.5%
jan 1, 2011
915.709 mln
+123.888 mln
15.65%
jan 1, 2012
991.854 mln
+76.145 mln
8.32%
jan 1, 2013
1.072 bln
+80.616 mln
8.13%
jan 1, 2014
1.339 bln
+266.498 mln
24.85%
jan 1, 2015
1.336 bln
-3.087 mln
-0.23%
jan 1, 2016
1.358 bln
+22.054 mln
1.65%
Ranking of countries by current statistics by years


Comments: