29
/
en
AIzaSyAYiBZKx7MnpbEhh9jyipgxe19OcubqV5w
April 1, 2024
228502
Romania
ROU
true
2
1
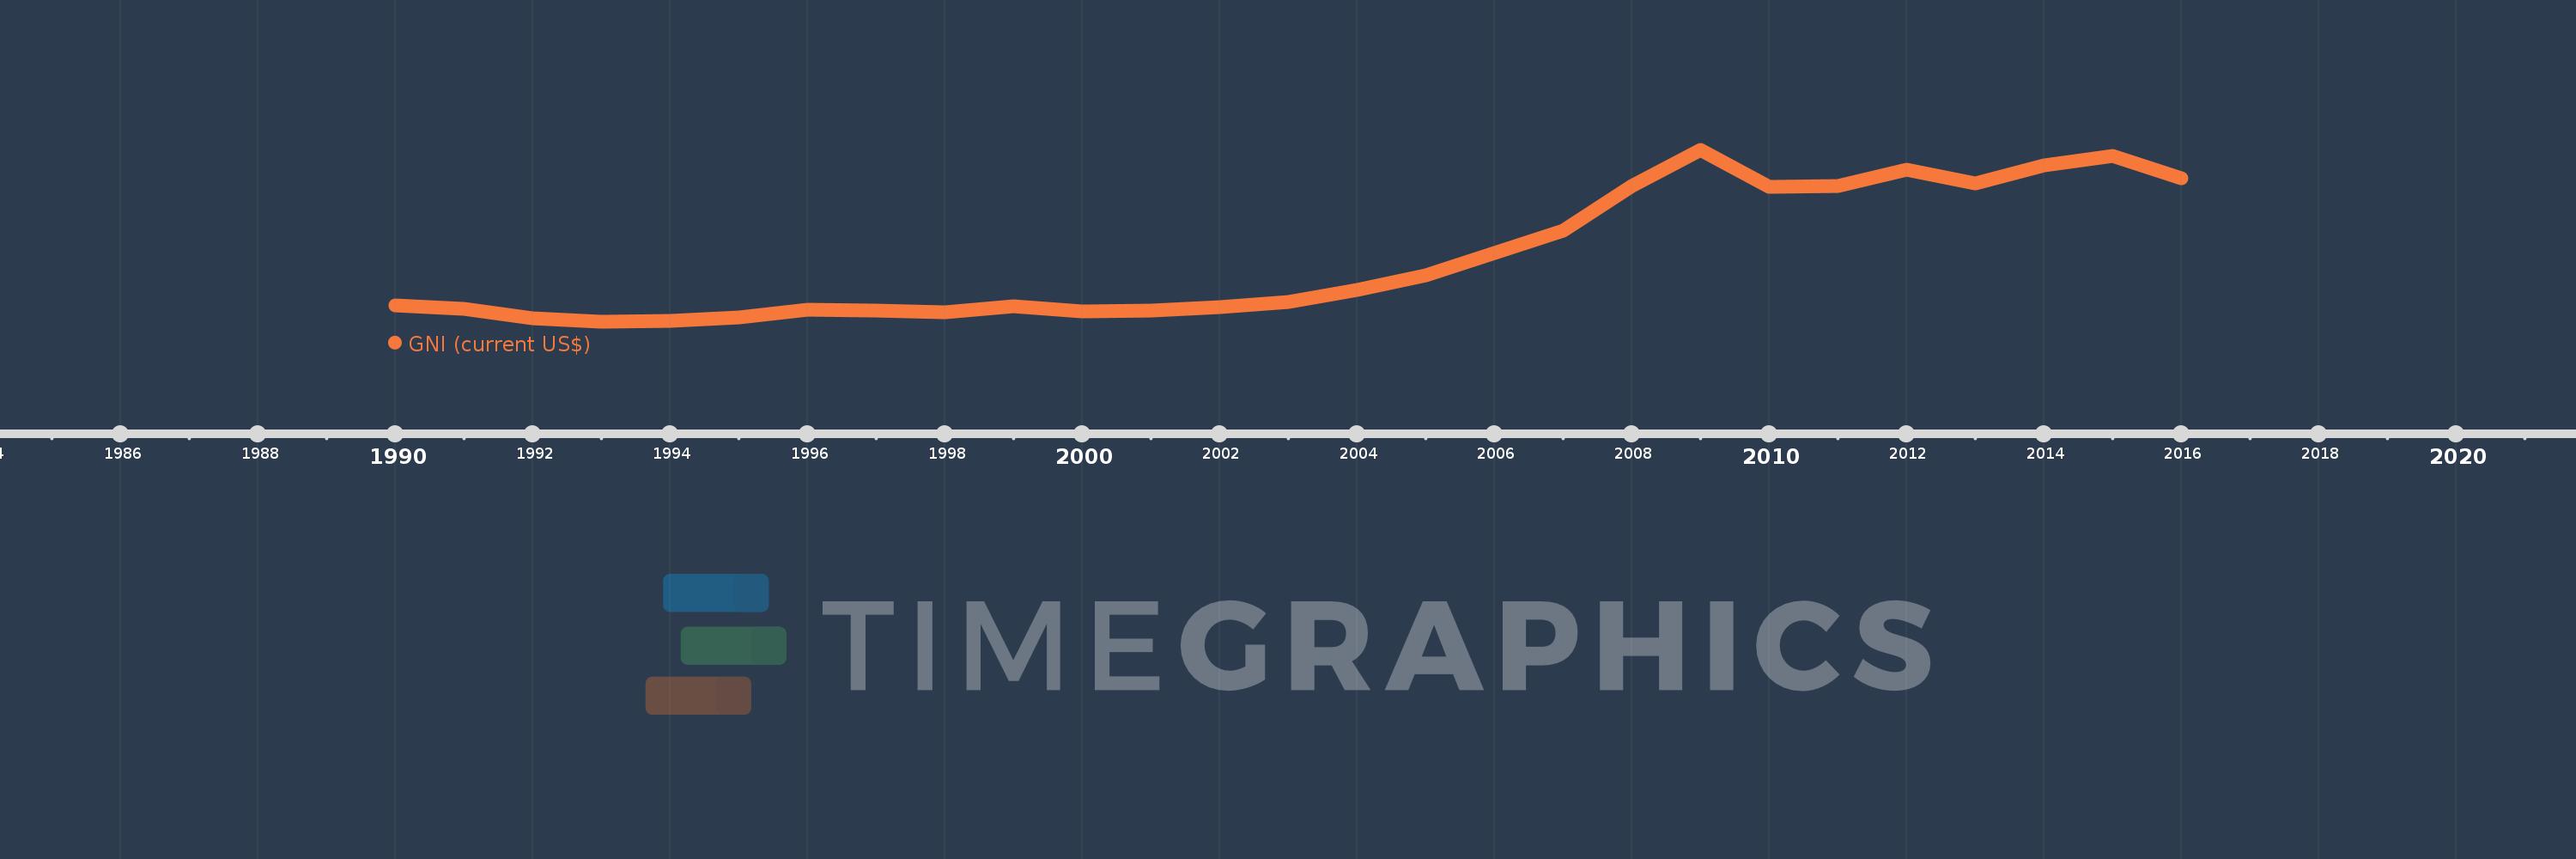
GNI (current US$)
2016,2015,2014,2013,2012,2011,2010,2009,2008,2007,2006,2005,2004,2003,2002,2001,2000,1999,1998,1997,1996,1995,1994,1993,1992,1991,1990
This statistics in other country:
AfghanistanAlbaniaAlgeriaAmerican SamoaAndorraAngolaAntigua and BarbudaArab WorldArgentinaArmeniaAustraliaAustriaAzerbaijanBahamas, TheBahrainBangladeshBarbadosBelarusBelgiumBelizeBeninBermudaBhutanBoliviaBosnia and HerzegovinaBotswanaBrazilBrunei DarussalamBulgariaBurkina FasoBurundiCabo VerdeCambodiaCameroonCanadaCaribbean small statesCentral African RepublicCentral Europe and the BalticsChadChannel IslandsChileChinaColombiaComorosCongo, Dem. Rep.Congo, Rep.Costa RicaCote d'IvoireCroatiaCubaCyprusCzech RepublicDenmarkDjiboutiDominicaDominican RepublicEarly-demographic dividendEast Asia & PacificEast Asia & Pacific (excluding high income)East Asia & Pacific (IDA & IBRD countries)EcuadorEgypt, Arab Rep.El SalvadorEquatorial GuineaEritreaEstoniaEthiopiaEuro areaEurope & Central AsiaEurope & Central Asia (excluding high income)Europe & Central Asia (IDA & IBRD countries)European UnionFaroe IslandsFijiFinlandFragile and conflict affected situationsFranceFrench PolynesiaGabonGambia, TheGeorgiaGermanyGhanaGreeceGreenlandGrenadaGuatemalaGuineaGuinea-BissauGuyanaHaitiHeavily indebted poor countries (HIPC)High incomeHondurasHong Kong SAR, ChinaHungaryIBRD onlyIcelandIDA & IBRD totalIDA blendIDA onlyIDA totalIndiaIndonesiaIran, Islamic Rep.IraqIrelandIsle of ManIsraelItalyJamaicaJapanJordanKazakhstanKenyaKiribatiKorea, Rep.KosovoKuwaitKyrgyz RepublicLao PDRLate-demographic dividendLatin America & Caribbean Latin America & Caribbean (excluding high income)Latin America & the Caribbean (IDA & IBRD countries)LatviaLeast developed countries: UN classificationLebanonLesothoLiberiaLibyaLiechtensteinLithuaniaLow & middle incomeLow incomeLower middle incomeLuxembourgMacao SAR, ChinaMacedonia, FYRMadagascarMalawiMalaysiaMaldivesMaliMaltaMarshall IslandsMauritaniaMauritiusMexicoMicronesia, Fed. Sts.Middle East & North AfricaMiddle East & North Africa (excluding high income)Middle East & North Africa (IDA & IBRD countries)Middle incomeMoldovaMonacoMongoliaMontenegroMoroccoMozambiqueMyanmarNamibiaNauruNepalNetherlandsNew CaledoniaNew ZealandNicaraguaNigerNigeriaNorth AmericaNorwayOECD membersOmanOther small statesPacific island small statesPakistanPalauPanamaPapua New GuineaParaguayPeruPhilippinesPolandPortugalPost-demographic dividendPre-demographic dividendPuerto RicoQatarRomaniaRussian FederationRwandaSamoaSan MarinoSao Tome and PrincipeSaudi ArabiaSenegalSerbiaSeychellesSierra LeoneSingaporeSlovak RepublicSloveniaSmall statesSolomon IslandsSomaliaSouth AfricaSouth AsiaSouth Asia (IDA & IBRD)South SudanSpainSri LankaSt. Kitts and NevisSt. LuciaSt. Vincent and the GrenadinesSub-Saharan Africa Sub-Saharan Africa (excluding high income)Sub-Saharan Africa (IDA & IBRD countries)SudanSurinameSwazilandSwedenSwitzerlandSyrian Arab RepublicTajikistanTanzaniaThailandTimor-LesteTogoTongaTrinidad and TobagoTunisiaTurkeyTurkmenistanTuvaluUgandaUkraineUnited Arab EmiratesUnited KingdomUnited StatesUpper middle incomeUruguayUzbekistanVanuatuVenezuela, RBVietnamVirgin Islands (U.S.)West Bank and GazaWorldYemen, Rep.ZambiaZimbabwe Timeline:
This timeline shows a graph from 1990 to 2016 of Romania. No data until 1989. Number of actual observations by date: 27.
Source name:
World Development Indicators
Source organization:
World Bank national accounts data, and OECD National Accounts data files.
Categories, topics:
Economy & Growth, External Debt
Last updated:
apr 23, 2017
Indicators value changes by year
Minimum:
25.032 bln
jan 1, 1993
Maximum:
202.797 bln
jan 1, 2009
At the date of observation
Value
Absolute change
Change from previous value
jan 1, 1990
42.187 bln
+42.187 bln
0.0%
jan 1, 1991
38.853 bln
-3.334 bln
-7.9%
jan 1, 1992
29.014 bln
-9.839 bln
-25.32%
jan 1, 1993
25.032 bln
-3.982 bln
-13.73%
jan 1, 1994
26.218 bln
+1.186 bln
4.74%
jan 1, 1995
29.945 bln
+3.728 bln
14.22%
jan 1, 1996
37.421 bln
+7.476 bln
24.96%
jan 1, 1997
36.875 bln
-546.255 mln
-1.46%
jan 1, 1998
35.516 bln
-1.358 bln
-3.68%
jan 1, 1999
41.479 bln
+5.962 bln
16.79%
jan 1, 2000
35.746 bln
-5.732 bln
-13.82%
jan 1, 2001
37.177 bln
+1.43 bln
4.0%
jan 1, 2002
40.464 bln
+3.288 bln
8.84%
jan 1, 2003
45.713 bln
+5.249 bln
12.97%
jan 1, 2004
58.516 bln
+12.803 bln
28.01%
jan 1, 2005
73.068 bln
+14.552 bln
24.87%
jan 1, 2006
96.805 bln
+23.737 bln
32.49%
jan 1, 2007
119.46 bln
+22.655 bln
23.4%
jan 1, 2008
165.888 bln
+46.428 bln
38.86%
jan 1, 2009
202.797 bln
+36.909 bln
22.25%
jan 1, 2010
164.78 bln
-38.017 bln
-18.75%
jan 1, 2011
165.463 bln
+682.588 mln
0.41%
jan 1, 2012
182.295 bln
+16.832 bln
10.17%
jan 1, 2013
168.704 bln
-13.59 bln
-7.46%
jan 1, 2014
187.417 bln
+18.712 bln
11.09%
jan 1, 2015
196.967 bln
+9.55 bln
5.1%
jan 1, 2016
173.811 bln
-23.156 bln
-11.76%
Ranking of countries by current statistics by years


Comments: