29
/
en
AIzaSyAYiBZKx7MnpbEhh9jyipgxe19OcubqV5w
April 1, 2024
240472
Singapore
SGP
true
2
1
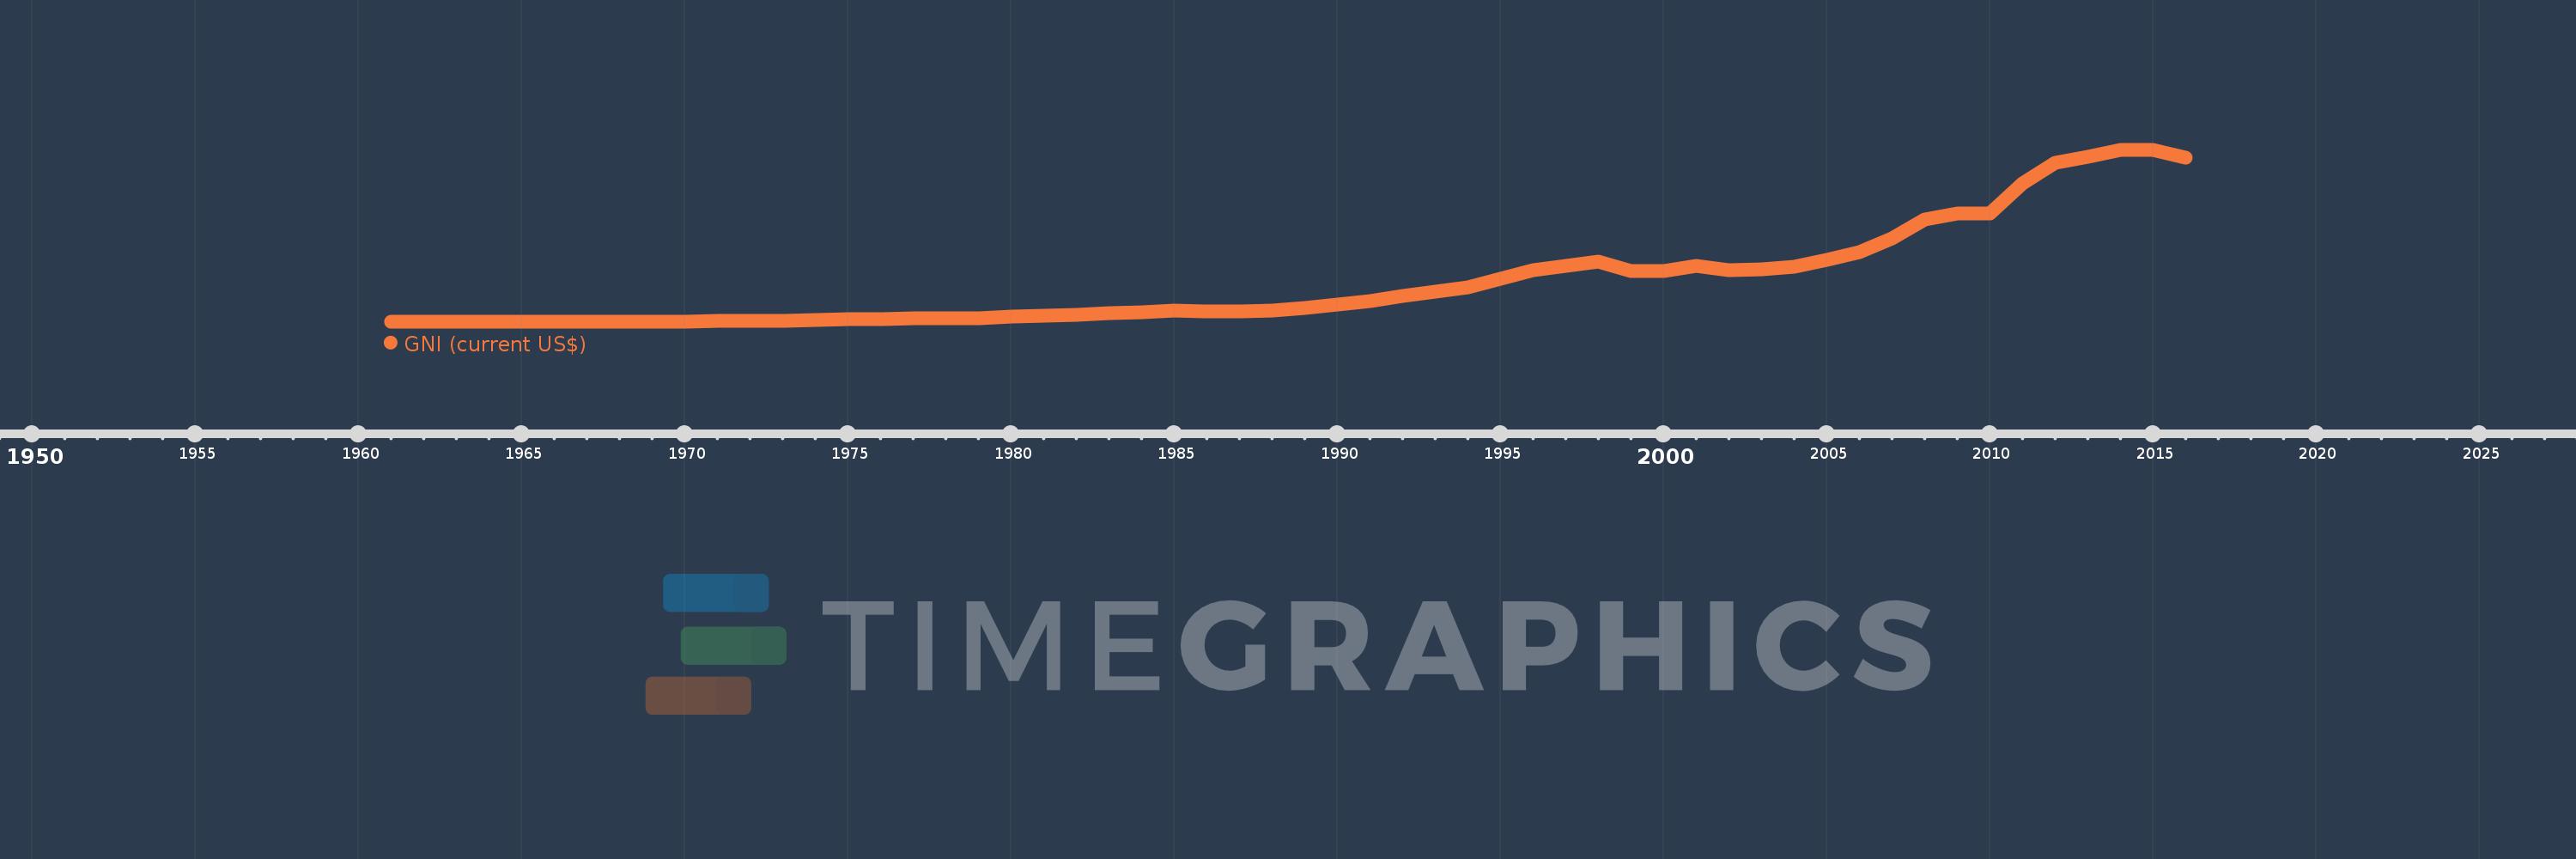
GNI (current US$)
2016,2015,2014,2013,2012,2011,2010,2009,2008,2007,2006,2005,2004,2003,2002,2001,2000,1999,1998,1997,1996,1995,1994,1993,1992,1991,1990,1989,1988,1987,1986,1985,1984,1983,1982,1981,1980,1979,1978,1977,1976,1975,1974,1973,1972,1971,1970,1969,1968,1967,1966,1965,1964,1963,1962,1961
This statistics in other country:
AfghanistanAlbaniaAlgeriaAmerican SamoaAndorraAngolaAntigua and BarbudaArab WorldArgentinaArmeniaAustraliaAustriaAzerbaijanBahamas, TheBahrainBangladeshBarbadosBelarusBelgiumBelizeBeninBermudaBhutanBoliviaBosnia and HerzegovinaBotswanaBrazilBrunei DarussalamBulgariaBurkina FasoBurundiCabo VerdeCambodiaCameroonCanadaCaribbean small statesCentral African RepublicCentral Europe and the BalticsChadChannel IslandsChileChinaColombiaComorosCongo, Dem. Rep.Congo, Rep.Costa RicaCote d'IvoireCroatiaCubaCyprusCzech RepublicDenmarkDjiboutiDominicaDominican RepublicEarly-demographic dividendEast Asia & PacificEast Asia & Pacific (excluding high income)East Asia & Pacific (IDA & IBRD countries)EcuadorEgypt, Arab Rep.El SalvadorEquatorial GuineaEritreaEstoniaEthiopiaEuro areaEurope & Central AsiaEurope & Central Asia (excluding high income)Europe & Central Asia (IDA & IBRD countries)European UnionFaroe IslandsFijiFinlandFragile and conflict affected situationsFranceFrench PolynesiaGabonGambia, TheGeorgiaGermanyGhanaGreeceGreenlandGrenadaGuatemalaGuineaGuinea-BissauGuyanaHaitiHeavily indebted poor countries (HIPC)High incomeHondurasHong Kong SAR, ChinaHungaryIBRD onlyIcelandIDA & IBRD totalIDA blendIDA onlyIDA totalIndiaIndonesiaIran, Islamic Rep.IraqIrelandIsle of ManIsraelItalyJamaicaJapanJordanKazakhstanKenyaKiribatiKorea, Rep.KosovoKuwaitKyrgyz RepublicLao PDRLate-demographic dividendLatin America & Caribbean Latin America & Caribbean (excluding high income)Latin America & the Caribbean (IDA & IBRD countries)LatviaLeast developed countries: UN classificationLebanonLesothoLiberiaLibyaLiechtensteinLithuaniaLow & middle incomeLow incomeLower middle incomeLuxembourgMacao SAR, ChinaMacedonia, FYRMadagascarMalawiMalaysiaMaldivesMaliMaltaMarshall IslandsMauritaniaMauritiusMexicoMicronesia, Fed. Sts.Middle East & North AfricaMiddle East & North Africa (excluding high income)Middle East & North Africa (IDA & IBRD countries)Middle incomeMoldovaMonacoMongoliaMontenegroMoroccoMozambiqueMyanmarNamibiaNauruNepalNetherlandsNew CaledoniaNew ZealandNicaraguaNigerNigeriaNorth AmericaNorwayOECD membersOmanOther small statesPacific island small statesPakistanPalauPanamaPapua New GuineaParaguayPeruPhilippinesPolandPortugalPost-demographic dividendPre-demographic dividendPuerto RicoQatarRomaniaRussian FederationRwandaSamoaSan MarinoSao Tome and PrincipeSaudi ArabiaSenegalSerbiaSeychellesSierra LeoneSingaporeSlovak RepublicSloveniaSmall statesSolomon IslandsSomaliaSouth AfricaSouth AsiaSouth Asia (IDA & IBRD)South SudanSpainSri LankaSt. Kitts and NevisSt. LuciaSt. Vincent and the GrenadinesSub-Saharan Africa Sub-Saharan Africa (excluding high income)Sub-Saharan Africa (IDA & IBRD countries)SudanSurinameSwazilandSwedenSwitzerlandSyrian Arab RepublicTajikistanTanzaniaThailandTimor-LesteTogoTongaTrinidad and TobagoTunisiaTurkeyTurkmenistanTuvaluUgandaUkraineUnited Arab EmiratesUnited KingdomUnited StatesUpper middle incomeUruguayUzbekistanVanuatuVenezuela, RBVietnamVirgin Islands (U.S.)West Bank and GazaWorldYemen, Rep.ZambiaZimbabwe Timeline:
This timeline shows a graph from 1961 to 2016 of Singapore. No data until 1960. Number of actual observations by date: 56.
Source name:
World Development Indicators
Source organization:
World Bank national accounts data, and OECD National Accounts data files.
Categories, topics:
Economy & Growth, External Debt
Last updated:
apr 23, 2017
Indicators value changes by year
Minimum:
717.333 mln
jan 1, 1961
Maximum:
291.213 bln
jan 1, 2015
At the date of observation
Value
Absolute change
Change from previous value
jan 1, 1961
717.333 mln
+717.333 mln
0.0%
jan 1, 1962
778.878 mln
+61.544 mln
8.58%
jan 1, 1963
841.925 mln
+63.047 mln
8.09%
jan 1, 1964
939.272 mln
+97.347 mln
11.56%
jan 1, 1965
922.024 mln
-17.248 mln
-1.84%
jan 1, 1966
1.006 bln
+83.562 mln
9.06%
jan 1, 1967
1.131 bln
+125.016 mln
12.43%
jan 1, 1968
1.269 bln
+138.769 mln
12.27%
jan 1, 1969
1.454 bln
+184.143 mln
14.51%
jan 1, 1970
1.687 bln
+233.209 mln
16.04%
jan 1, 1971
1.938 bln
+251.143 mln
14.89%
jan 1, 1972
2.259 bln
+321.41 mln
16.59%
jan 1, 1973
2.713 bln
+453.87 mln
20.09%
jan 1, 1974
3.614 bln
+901.003 mln
33.21%
jan 1, 1975
5.074 bln
+1.46 bln
40.4%
jan 1, 1976
5.684 bln
+609.963 mln
12.02%
jan 1, 1977
6.292 bln
+608.095 mln
10.7%
jan 1, 1978
6.542 bln
+249.567 mln
3.97%
jan 1, 1979
7.498 bln
+956.469 mln
14.62%
jan 1, 1980
9.26 bln
+1.762 bln
23.5%
jan 1, 1981
11.283 bln
+2.023 bln
21.85%
jan 1, 1982
13.356 bln
+2.073 bln
18.37%
jan 1, 1983
15.268 bln
+1.912 bln
14.31%
jan 1, 1984
17.281 bln
+2.012 bln
13.18%
jan 1, 1985
19.611 bln
+2.33 bln
13.48%
jan 1, 1986
19.297 bln
-313.944 mln
-1.6%
jan 1, 1987
18.575 bln
-721.367 mln
-3.74%
jan 1, 1988
20.35 bln
+1.775 bln
9.55%
jan 1, 1989
24.991 bln
+4.641 bln
22.81%
jan 1, 1990
30.238 bln
+5.247 bln
20.99%
jan 1, 1991
35.789 bln
+5.55 bln
18.36%
jan 1, 1992
44.788 bln
+8.999 bln
25.14%
jan 1, 1993
52.188 bln
+7.4 bln
16.52%
jan 1, 1994
59.365 bln
+7.177 bln
13.75%
jan 1, 1995
73.874 bln
+14.508 bln
24.44%
jan 1, 1996
88.525 bln
+14.652 bln
19.83%
jan 1, 1997
95.712 bln
+7.187 bln
8.12%
jan 1, 1998
102.126 bln
+6.414 bln
6.7%
jan 1, 1999
86.972 bln
-15.154 bln
-14.84%
jan 1, 2000
87.26 bln
+288.256 mln
0.33%
jan 1, 2001
95.247 bln
+7.986 bln
9.15%
jan 1, 2002
88.352 bln
-6.895 bln
-7.24%
jan 1, 2003
89.368 bln
+1.016 bln
1.15%
jan 1, 2004
93.638 bln
+4.271 bln
4.78%
jan 1, 2005
106.147 bln
+12.509 bln
13.36%
jan 1, 2006
118.992 bln
+12.845 bln
12.1%
jan 1, 2007
142.549 bln
+23.557 bln
19.8%
jan 1, 2008
174.304 bln
+31.755 bln
22.28%
jan 1, 2009
183.556 bln
+9.252 bln
5.31%
jan 1, 2010
183.492 bln
-63.665 mln
-0.03%
jan 1, 2011
235.076 bln
+51.584 bln
28.11%
jan 1, 2012
269.227 bln
+34.151 bln
14.53%
jan 1, 2013
280.07 bln
+10.844 bln
4.03%
jan 1, 2014
291.171 bln
+11.1 bln
3.96%
jan 1, 2015
291.213 bln
+41.827 mln
0.01%
jan 1, 2016
278.938 bln
-12.274 bln
-4.21%
Ranking of countries by current statistics by years


Comments: