29
/
en
AIzaSyAYiBZKx7MnpbEhh9jyipgxe19OcubqV5w
April 1, 2024
227434
Qatar
QAT
true
2
1
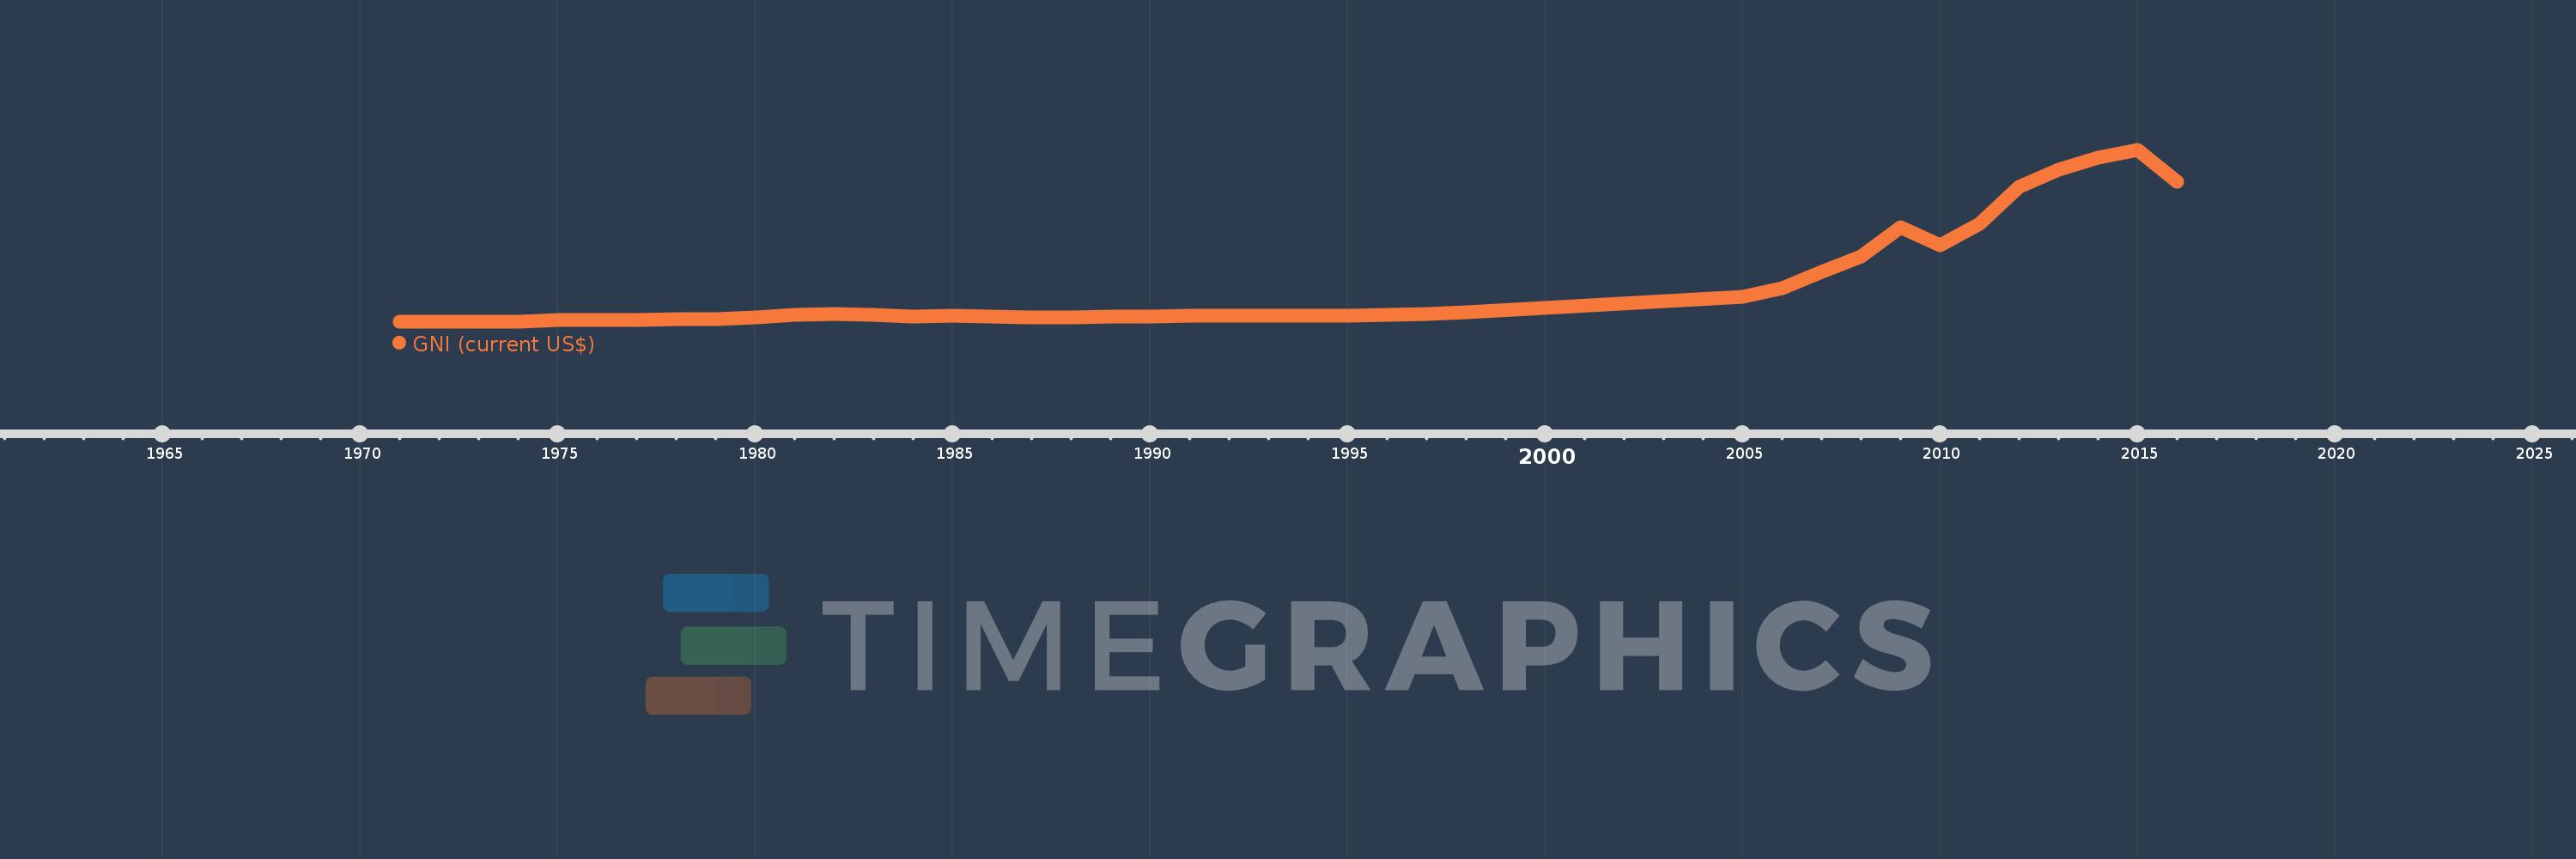
GNI (current US$)
2016,2015,2014,2013,2012,2011,2010,2009,2008,2007,2006,2005,1998,1997,1996,1995,1994,1993,1992,1991,1990,1989,1988,1987,1986,1985,1984,1983,1982,1981,1980,1979,1978,1977,1976,1975,1974,1973,1972,1971
This statistics in other country:
AfghanistanAlbaniaAlgeriaAmerican SamoaAndorraAngolaAntigua and BarbudaArab WorldArgentinaArmeniaAustraliaAustriaAzerbaijanBahamas, TheBahrainBangladeshBarbadosBelarusBelgiumBelizeBeninBermudaBhutanBoliviaBosnia and HerzegovinaBotswanaBrazilBrunei DarussalamBulgariaBurkina FasoBurundiCabo VerdeCambodiaCameroonCanadaCaribbean small statesCentral African RepublicCentral Europe and the BalticsChadChannel IslandsChileChinaColombiaComorosCongo, Dem. Rep.Congo, Rep.Costa RicaCote d'IvoireCroatiaCubaCyprusCzech RepublicDenmarkDjiboutiDominicaDominican RepublicEarly-demographic dividendEast Asia & PacificEast Asia & Pacific (excluding high income)East Asia & Pacific (IDA & IBRD countries)EcuadorEgypt, Arab Rep.El SalvadorEquatorial GuineaEritreaEstoniaEthiopiaEuro areaEurope & Central AsiaEurope & Central Asia (excluding high income)Europe & Central Asia (IDA & IBRD countries)European UnionFaroe IslandsFijiFinlandFragile and conflict affected situationsFranceFrench PolynesiaGabonGambia, TheGeorgiaGermanyGhanaGreeceGreenlandGrenadaGuatemalaGuineaGuinea-BissauGuyanaHaitiHeavily indebted poor countries (HIPC)High incomeHondurasHong Kong SAR, ChinaHungaryIBRD onlyIcelandIDA & IBRD totalIDA blendIDA onlyIDA totalIndiaIndonesiaIran, Islamic Rep.IraqIrelandIsle of ManIsraelItalyJamaicaJapanJordanKazakhstanKenyaKiribatiKorea, Rep.KosovoKuwaitKyrgyz RepublicLao PDRLate-demographic dividendLatin America & Caribbean Latin America & Caribbean (excluding high income)Latin America & the Caribbean (IDA & IBRD countries)LatviaLeast developed countries: UN classificationLebanonLesothoLiberiaLibyaLiechtensteinLithuaniaLow & middle incomeLow incomeLower middle incomeLuxembourgMacao SAR, ChinaMacedonia, FYRMadagascarMalawiMalaysiaMaldivesMaliMaltaMarshall IslandsMauritaniaMauritiusMexicoMicronesia, Fed. Sts.Middle East & North AfricaMiddle East & North Africa (excluding high income)Middle East & North Africa (IDA & IBRD countries)Middle incomeMoldovaMonacoMongoliaMontenegroMoroccoMozambiqueMyanmarNamibiaNauruNepalNetherlandsNew CaledoniaNew ZealandNicaraguaNigerNigeriaNorth AmericaNorwayOECD membersOmanOther small statesPacific island small statesPakistanPalauPanamaPapua New GuineaParaguayPeruPhilippinesPolandPortugalPost-demographic dividendPre-demographic dividendPuerto RicoQatarRomaniaRussian FederationRwandaSamoaSan MarinoSao Tome and PrincipeSaudi ArabiaSenegalSerbiaSeychellesSierra LeoneSingaporeSlovak RepublicSloveniaSmall statesSolomon IslandsSomaliaSouth AfricaSouth AsiaSouth Asia (IDA & IBRD)South SudanSpainSri LankaSt. Kitts and NevisSt. LuciaSt. Vincent and the GrenadinesSub-Saharan Africa Sub-Saharan Africa (excluding high income)Sub-Saharan Africa (IDA & IBRD countries)SudanSurinameSwazilandSwedenSwitzerlandSyrian Arab RepublicTajikistanTanzaniaThailandTimor-LesteTogoTongaTrinidad and TobagoTunisiaTurkeyTurkmenistanTuvaluUgandaUkraineUnited Arab EmiratesUnited KingdomUnited StatesUpper middle incomeUruguayUzbekistanVanuatuVenezuela, RBVietnamVirgin Islands (U.S.)West Bank and GazaWorldYemen, Rep.ZambiaZimbabwe Timeline:
This timeline shows a graph from 1971 to 2016 of Qatar. No data until 1970. Number of actual observations by date: 40.
Source name:
World Development Indicators
Source organization:
World Bank national accounts data, and OECD National Accounts data files.
Categories, topics:
Economy & Growth, External Debt
Last updated:
apr 23, 2017
Indicators value changes by year
Minimum:
287.784 mln
jan 1, 1971
Maximum:
196.924 bln
jan 1, 2015
At the date of observation
Value
Absolute change
Change from previous value
jan 1, 1971
287.784 mln
+287.784 mln
0.0%
jan 1, 1972
355.708 mln
+67.923 mln
23.6%
jan 1, 1973
447.332 mln
+91.625 mln
25.76%
jan 1, 1974
689.137 mln
+241.805 mln
54.05%
jan 1, 1975
2.359 bln
+1.67 bln
242.36%
jan 1, 1976
2.403 bln
+43.529 mln
1.84%
jan 1, 1977
3.017 bln
+614.479 mln
25.57%
jan 1, 1978
3.169 bln
+152.128 mln
5.04%
jan 1, 1979
3.636 bln
+466.459 mln
14.72%
jan 1, 1980
5.167 bln
+1.531 bln
42.11%
jan 1, 1981
8.37 bln
+3.203 bln
61.99%
jan 1, 1982
9.196 bln
+826.179 mln
9.87%
jan 1, 1983
8.145 bln
-1.052 bln
-11.43%
jan 1, 1984
6.927 bln
-1.218 bln
-14.96%
jan 1, 1985
7.073 bln
+146.483 mln
2.11%
jan 1, 1986
6.722 bln
-351.374 mln
-4.97%
jan 1, 1987
5.677 bln
-1.045 bln
-15.54%
jan 1, 1988
5.925 bln
+248.077 mln
4.37%
jan 1, 1989
6.339 bln
+414.176 mln
6.99%
jan 1, 1990
6.686 bln
+346.73 mln
5.47%
jan 1, 1991
7.581 bln
+895.522 mln
13.39%
jan 1, 1992
7.084 bln
-497.912 mln
-6.57%
jan 1, 1993
7.869 bln
+785.44 mln
11.09%
jan 1, 1994
7.365 bln
-503.846 mln
-6.4%
jan 1, 1995
7.589 bln
+224.205 mln
3.04%
jan 1, 1996
8.375 bln
+785.706 mln
10.35%
jan 1, 1997
9.323 bln
+948.276 mln
11.32%
jan 1, 1998
11.627 bln
+2.304 bln
24.71%
jan 1, 2005
29.492 bln
+17.865 bln
153.65%
jan 1, 2006
38.815 bln
+9.323 bln
31.61%
jan 1, 2007
57.602 bln
+18.787 bln
48.4%
jan 1, 2008
75.473 bln
+17.871 bln
31.03%
jan 1, 2009
108.508 bln
+33.035 bln
43.77%
jan 1, 2010
88.386 bln
-20.122 bln
-18.54%
jan 1, 2011
112.179 bln
+23.793 bln
26.92%
jan 1, 2012
154.504 bln
+42.326 bln
37.73%
jan 1, 2013
174.709 bln
+20.204 bln
13.08%
jan 1, 2014
188.364 bln
+13.655 bln
7.82%
jan 1, 2015
196.924 bln
+8.56 bln
4.54%
jan 1, 2016
161.076 bln
-35.848 bln
-18.2%
Ranking of countries by current statistics by years


Comments: