29
/
en
AIzaSyAYiBZKx7MnpbEhh9jyipgxe19OcubqV5w
April 1, 2024
102453
Central African Republic
CAF
true
2
1
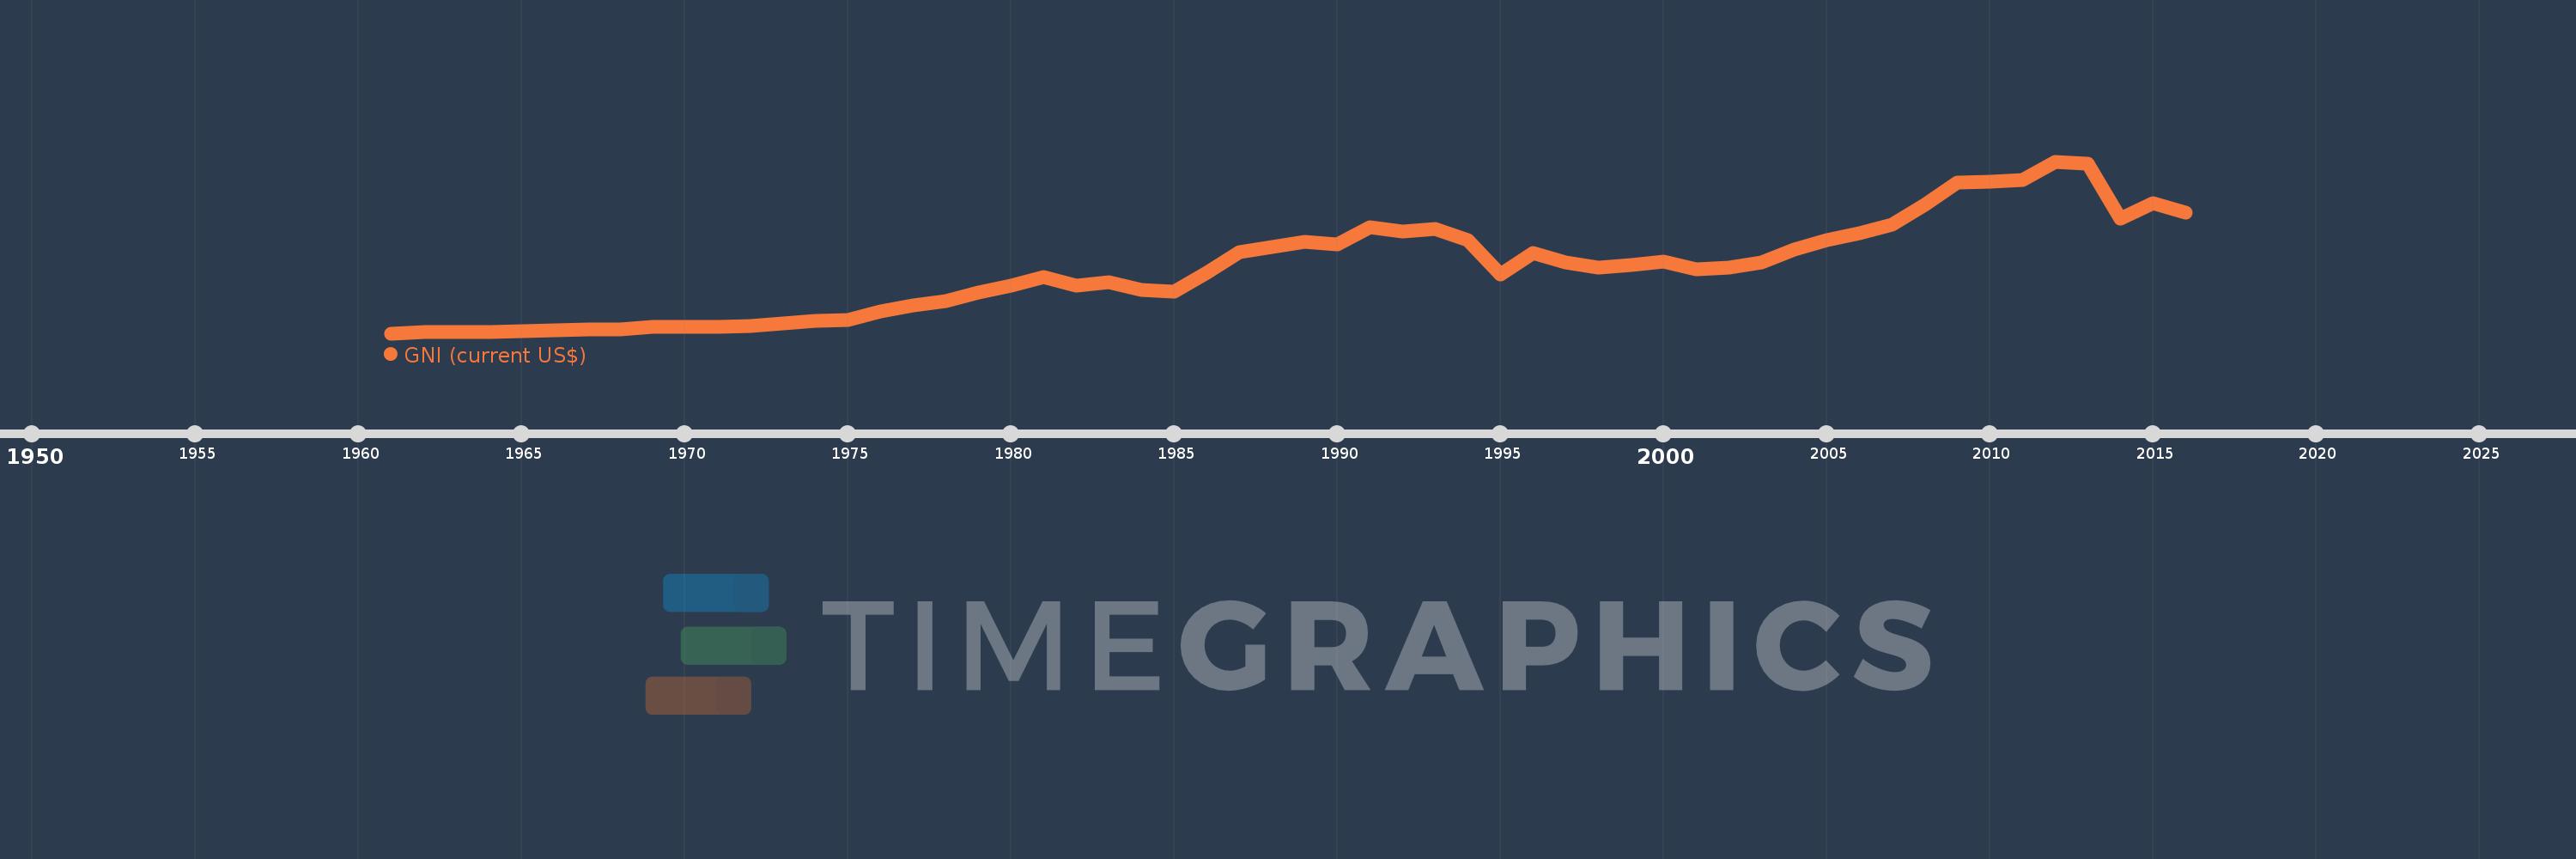
GNI (current US$)
2016,2015,2014,2013,2012,2011,2010,2009,2008,2007,2006,2005,2004,2003,2002,2001,2000,1999,1998,1997,1996,1995,1994,1993,1992,1991,1990,1989,1988,1987,1986,1985,1984,1983,1982,1981,1980,1979,1978,1977,1976,1975,1974,1973,1972,1971,1970,1969,1968,1967,1966,1965,1964,1963,1962,1961
This statistics in other country:
AfghanistanAlbaniaAlgeriaAmerican SamoaAndorraAngolaAntigua and BarbudaArab WorldArgentinaArmeniaAustraliaAustriaAzerbaijanBahamas, TheBahrainBangladeshBarbadosBelarusBelgiumBelizeBeninBermudaBhutanBoliviaBosnia and HerzegovinaBotswanaBrazilBrunei DarussalamBulgariaBurkina FasoBurundiCabo VerdeCambodiaCameroonCanadaCaribbean small statesCentral African RepublicCentral Europe and the BalticsChadChannel IslandsChileChinaColombiaComorosCongo, Dem. Rep.Congo, Rep.Costa RicaCote d'IvoireCroatiaCubaCyprusCzech RepublicDenmarkDjiboutiDominicaDominican RepublicEarly-demographic dividendEast Asia & PacificEast Asia & Pacific (excluding high income)East Asia & Pacific (IDA & IBRD countries)EcuadorEgypt, Arab Rep.El SalvadorEquatorial GuineaEritreaEstoniaEthiopiaEuro areaEurope & Central AsiaEurope & Central Asia (excluding high income)Europe & Central Asia (IDA & IBRD countries)European UnionFaroe IslandsFijiFinlandFragile and conflict affected situationsFranceFrench PolynesiaGabonGambia, TheGeorgiaGermanyGhanaGreeceGreenlandGrenadaGuatemalaGuineaGuinea-BissauGuyanaHaitiHeavily indebted poor countries (HIPC)High incomeHondurasHong Kong SAR, ChinaHungaryIBRD onlyIcelandIDA & IBRD totalIDA blendIDA onlyIDA totalIndiaIndonesiaIran, Islamic Rep.IraqIrelandIsle of ManIsraelItalyJamaicaJapanJordanKazakhstanKenyaKiribatiKorea, Rep.KosovoKuwaitKyrgyz RepublicLao PDRLate-demographic dividendLatin America & Caribbean Latin America & Caribbean (excluding high income)Latin America & the Caribbean (IDA & IBRD countries)LatviaLeast developed countries: UN classificationLebanonLesothoLiberiaLibyaLiechtensteinLithuaniaLow & middle incomeLow incomeLower middle incomeLuxembourgMacao SAR, ChinaMacedonia, FYRMadagascarMalawiMalaysiaMaldivesMaliMaltaMarshall IslandsMauritaniaMauritiusMexicoMicronesia, Fed. Sts.Middle East & North AfricaMiddle East & North Africa (excluding high income)Middle East & North Africa (IDA & IBRD countries)Middle incomeMoldovaMonacoMongoliaMontenegroMoroccoMozambiqueMyanmarNamibiaNauruNepalNetherlandsNew CaledoniaNew ZealandNicaraguaNigerNigeriaNorth AmericaNorwayOECD membersOmanOther small statesPacific island small statesPakistanPalauPanamaPapua New GuineaParaguayPeruPhilippinesPolandPortugalPost-demographic dividendPre-demographic dividendPuerto RicoQatarRomaniaRussian FederationRwandaSamoaSan MarinoSao Tome and PrincipeSaudi ArabiaSenegalSerbiaSeychellesSierra LeoneSingaporeSlovak RepublicSloveniaSmall statesSolomon IslandsSomaliaSouth AfricaSouth AsiaSouth Asia (IDA & IBRD)South SudanSpainSri LankaSt. Kitts and NevisSt. LuciaSt. Vincent and the GrenadinesSub-Saharan Africa Sub-Saharan Africa (excluding high income)Sub-Saharan Africa (IDA & IBRD countries)SudanSurinameSwazilandSwedenSwitzerlandSyrian Arab RepublicTajikistanTanzaniaThailandTimor-LesteTogoTongaTrinidad and TobagoTunisiaTurkeyTurkmenistanTuvaluUgandaUkraineUnited Arab EmiratesUnited KingdomUnited StatesUpper middle incomeUruguayUzbekistanVanuatuVenezuela, RBVietnamVirgin Islands (U.S.)West Bank and GazaWorldYemen, Rep.ZambiaZimbabwe Timeline:
This timeline shows a graph from 1961 to 2016 of Central African Republic. No data until 1960. Number of actual observations by date: 56.
Source name:
World Development Indicators
Source organization:
World Bank national accounts data, and OECD National Accounts data files.
Categories, topics:
Economy & Growth, External Debt
Last updated:
apr 23, 2017
Indicators value changes by year
Minimum:
111.748 mln
jan 1, 1961
Maximum:
2.222 bln
jan 1, 2012
At the date of observation
Value
Absolute change
Change from previous value
jan 1, 1961
111.748 mln
+111.748 mln
0.0%
jan 1, 1962
122.727 mln
+10.979 mln
9.82%
jan 1, 1963
124.075 mln
+1.348 mln
1.1%
jan 1, 1964
128.971 mln
+4.896 mln
3.95%
jan 1, 1965
141.617 mln
+12.646 mln
9.81%
jan 1, 1966
150.167 mln
+8.55 mln
6.04%
jan 1, 1967
157.523 mln
+7.356 mln
4.9%
jan 1, 1968
163.414 mln
+5.891 mln
3.74%
jan 1, 1969
188.467 mln
+25.053 mln
15.33%
jan 1, 1970
186.939 mln
-1.528 mln
-0.81%
jan 1, 1971
187.307 mln
+367.426K
0.2%
jan 1, 1972
198.941 mln
+11.634 mln
6.21%
jan 1, 1973
228.251 mln
+29.31 mln
14.73%
jan 1, 1974
268.084 mln
+39.832 mln
17.45%
jan 1, 1975
278.993 mln
+10.91 mln
4.07%
jan 1, 1976
376.717 mln
+97.724 mln
35.03%
jan 1, 1977
450.46 mln
+73.742 mln
19.57%
jan 1, 1978
506.692 mln
+56.232 mln
12.48%
jan 1, 1979
611.779 mln
+105.087 mln
20.74%
jan 1, 1980
695.365 mln
+83.586 mln
13.66%
jan 1, 1981
799.613 mln
+104.248 mln
14.99%
jan 1, 1982
698.105 mln
-101.509 mln
-12.69%
jan 1, 1983
741.049 mln
+42.945 mln
6.15%
jan 1, 1984
647.991 mln
-93.058 mln
-12.56%
jan 1, 1985
628.157 mln
-19.834 mln
-3.06%
jan 1, 1986
857.55 mln
+229.393 mln
36.52%
jan 1, 1987
1.11 bln
+252.315 mln
29.42%
jan 1, 1988
1.177 bln
+67.016 mln
6.04%
jan 1, 1989
1.237 bln
+60.52 mln
5.14%
jan 1, 1990
1.208 bln
-29.105 mln
-2.35%
jan 1, 1991
1.418 bln
+209.977 mln
17.38%
jan 1, 1992
1.361 bln
-57.017 mln
-4.02%
jan 1, 1993
1.396 bln
+35.171 mln
2.58%
jan 1, 1994
1.26 bln
-136.364 mln
-9.77%
jan 1, 1995
830.378 mln
-429.686 mln
-34.1%
jan 1, 1996
1.094 bln
+264.015 mln
31.79%
jan 1, 1997
986.713 mln
-107.68 mln
-9.84%
jan 1, 1998
922.003 mln
-64.71 mln
-6.56%
jan 1, 1999
948.608 mln
+26.605 mln
2.89%
jan 1, 2000
991.334 mln
+42.726 mln
4.5%
jan 1, 2001
901.436 mln
-89.898 mln
-9.07%
jan 1, 2002
924.01 mln
+22.574 mln
2.5%
jan 1, 2003
982.309 mln
+58.299 mln
6.31%
jan 1, 2004
1.137 bln
+154.658 mln
15.74%
jan 1, 2005
1.256 bln
+119.299 mln
10.49%
jan 1, 2006
1.34 bln
+83.814 mln
6.67%
jan 1, 2007
1.449 bln
+109.01 mln
8.13%
jan 1, 2008
1.687 bln
+237.782 mln
16.41%
jan 1, 2009
1.962 bln
+275.618 mln
16.34%
jan 1, 2010
1.976 bln
+13.415 mln
0.68%
jan 1, 2011
1.996 bln
+19.745 mln
1.0%
jan 1, 2012
2.222 bln
+226.765 mln
11.36%
jan 1, 2013
2.195 bln
-27.009 mln
-1.22%
jan 1, 2014
1.524 bln
-671.244 mln
-30.57%
jan 1, 2015
1.71 bln
+185.913 mln
12.2%
jan 1, 2016
1.591 bln
-119.329 mln
-6.98%
Ranking of countries by current statistics by years


Comments: