29
/
en
AIzaSyAYiBZKx7MnpbEhh9jyipgxe19OcubqV5w
April 1, 2024
31662
Europe & Central Asia (excluding high income)
ECA
false
2
1
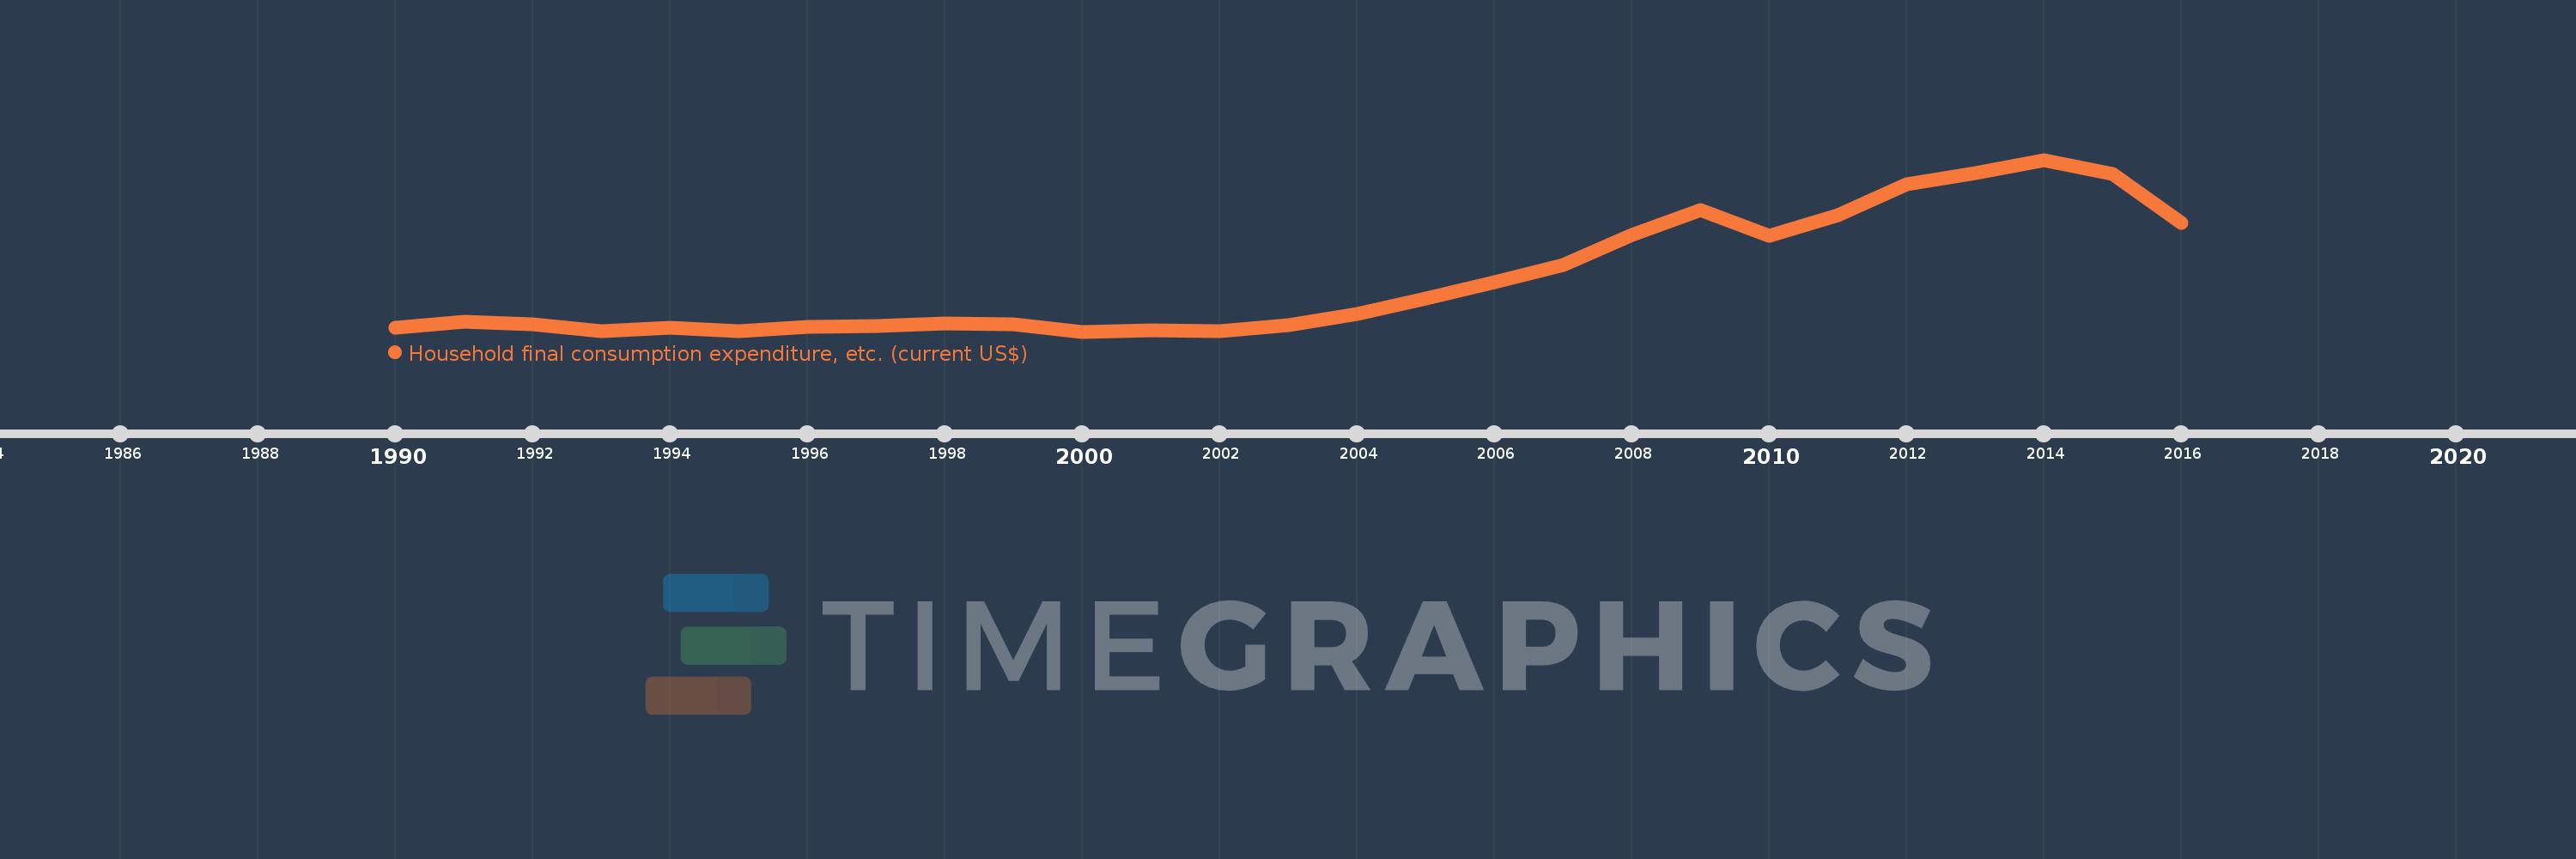
Household final consumption expenditure, etc. (current US$)
2016,2015,2014,2013,2012,2011,2010,2009,2008,2007,2006,2005,2004,2003,2002,2001,2000,1999,1998,1997,1996,1995,1994,1993,1992,1991,1990
This statistics in other country:
AfghanistanAlbaniaAlgeriaAngolaAntigua and BarbudaArab WorldArgentinaArmeniaArubaAustraliaAustriaAzerbaijanBahamas, TheBahrainBangladeshBarbadosBelarusBelgiumBelizeBeninBermudaBhutanBoliviaBosnia and HerzegovinaBotswanaBrazilBrunei DarussalamBulgariaBurkina FasoBurundiCabo VerdeCambodiaCameroonCanadaCaribbean small statesCentral African RepublicCentral Europe and the BalticsChadChileChinaColombiaComorosCongo, Dem. Rep.Congo, Rep.Costa RicaCote d'IvoireCroatiaCubaCyprusCzech RepublicDenmarkDjiboutiDominicaDominican RepublicEarly-demographic dividendEast Asia & PacificEast Asia & Pacific (excluding high income)East Asia & Pacific (IDA & IBRD countries)EcuadorEgypt, Arab Rep.El SalvadorEquatorial GuineaEritreaEstoniaEthiopiaEuro areaEurope & Central AsiaEurope & Central Asia (excluding high income)Europe & Central Asia (IDA & IBRD countries)European UnionFaroe IslandsFijiFinlandFragile and conflict affected situationsFranceGabonGambia, TheGeorgiaGermanyGhanaGreeceGrenadaGuatemalaGuineaGuinea-BissauGuyanaHaitiHeavily indebted poor countries (HIPC)High incomeHondurasHong Kong SAR, ChinaHungaryIBRD onlyIcelandIDA & IBRD totalIDA blendIDA onlyIDA totalIndiaIndonesiaIran, Islamic Rep.IraqIrelandIsraelItalyJamaicaJapanJordanKazakhstanKenyaKiribatiKorea, Rep.KosovoKuwaitKyrgyz RepublicLao PDRLate-demographic dividendLatin America & Caribbean Latin America & Caribbean (excluding high income)Latin America & the Caribbean (IDA & IBRD countries)LatviaLeast developed countries: UN classificationLebanonLesothoLiberiaLibyaLithuaniaLow & middle incomeLow incomeLower middle incomeLuxembourgMacao SAR, ChinaMacedonia, FYRMadagascarMalawiMalaysiaMaldivesMaliMaltaMauritaniaMauritiusMexicoMicronesia, Fed. Sts.Middle East & North AfricaMiddle East & North Africa (excluding high income)Middle East & North Africa (IDA & IBRD countries)Middle incomeMoldovaMongoliaMontenegroMoroccoMozambiqueNamibiaNepalNetherlandsNew CaledoniaNew ZealandNicaraguaNigerNigeriaNorth AmericaNorwayOECD membersOmanOther small statesPakistanPanamaPapua New GuineaParaguayPeruPhilippinesPolandPortugalPost-demographic dividendPre-demographic dividendPuerto RicoQatarRomaniaRussian FederationRwandaSaudi ArabiaSenegalSerbiaSeychellesSierra LeoneSingaporeSlovak RepublicSloveniaSmall statesSolomon IslandsSouth AfricaSouth AsiaSouth Asia (IDA & IBRD)South SudanSpainSri LankaSt. Kitts and NevisSt. LuciaSt. Vincent and the GrenadinesSub-Saharan Africa Sub-Saharan Africa (excluding high income)Sub-Saharan Africa (IDA & IBRD countries)SudanSurinameSwazilandSwedenSwitzerlandSyrian Arab RepublicTajikistanTanzaniaThailandTimor-LesteTogoTongaTrinidad and TobagoTunisiaTurkeyTurkmenistanUgandaUkraineUnited Arab EmiratesUnited KingdomUnited StatesUpper middle incomeUruguayUzbekistanVanuatuVenezuela, RBVietnamWest Bank and GazaWorldYemen, Rep.ZambiaZimbabwe Timeline:
This timeline shows a graph from 1990 to 2016 of Europe & Central Asia (excluding high income). No data until 1989. Number of actual observations by date: 27.
Source name:
World Development Indicators
Source organization:
World Bank national accounts data, and OECD National Accounts data files.
Categories, topics:
Economy & Growth
Last updated:
apr 23, 2017
Indicators value changes by year
Minimum:
397.157 bln
jan 1, 2000
Maximum:
2.42 trl
jan 1, 2014
At the date of observation
Value
Absolute change
Change from previous value
jan 1, 1990
439.057 bln
+439.057 bln
0.0%
jan 1, 1991
514.857 bln
+75.8 bln
17.26%
jan 1, 1992
483.754 bln
-31.103 bln
-6.04%
jan 1, 1993
397.682 bln
-86.072 bln
-17.79%
jan 1, 1994
440.44 bln
+42.758 bln
10.75%
jan 1, 1995
405.027 bln
-35.414 bln
-8.04%
jan 1, 1996
449.055 bln
+44.028 bln
10.87%
jan 1, 1997
466.65 bln
+17.596 bln
3.92%
jan 1, 1998
490.134 bln
+23.484 bln
5.03%
jan 1, 1999
481.382 bln
-8.752 bln
-1.79%
jan 1, 2000
397.157 bln
-84.225 bln
-17.5%
jan 1, 2001
416.251 bln
+19.095 bln
4.81%
jan 1, 2002
406.544 bln
-9.708 bln
-2.33%
jan 1, 2003
473.527 bln
+66.983 bln
16.48%
jan 1, 2004
599.794 bln
+126.268 bln
26.67%
jan 1, 2005
786.291 bln
+186.497 bln
31.09%
jan 1, 2006
983.604 bln
+197.313 bln
25.09%
jan 1, 2007
1.176 trl
+192.292 bln
19.55%
jan 1, 2008
1.535 trl
+359.084 bln
30.54%
jan 1, 2009
1.823 trl
+288.445 bln
18.79%
jan 1, 2010
1.527 trl
-296.836 bln
-16.28%
jan 1, 2011
1.769 trl
+242.52 bln
15.89%
jan 1, 2012
2.132 trl
+362.461 bln
20.49%
jan 1, 2013
2.261 trl
+129.752 bln
6.09%
jan 1, 2014
2.42 trl
+158.313 bln
7.0%
jan 1, 2015
2.255 trl
-164.472 bln
-6.8%
jan 1, 2016
1.675 trl
-580.457 bln
-25.74%
Ranking of countries by current statistics by years


Comments: