29
/
en
AIzaSyAYiBZKx7MnpbEhh9jyipgxe19OcubqV5w
April 1, 2024
256440
Sweden
SWE
true
2
1
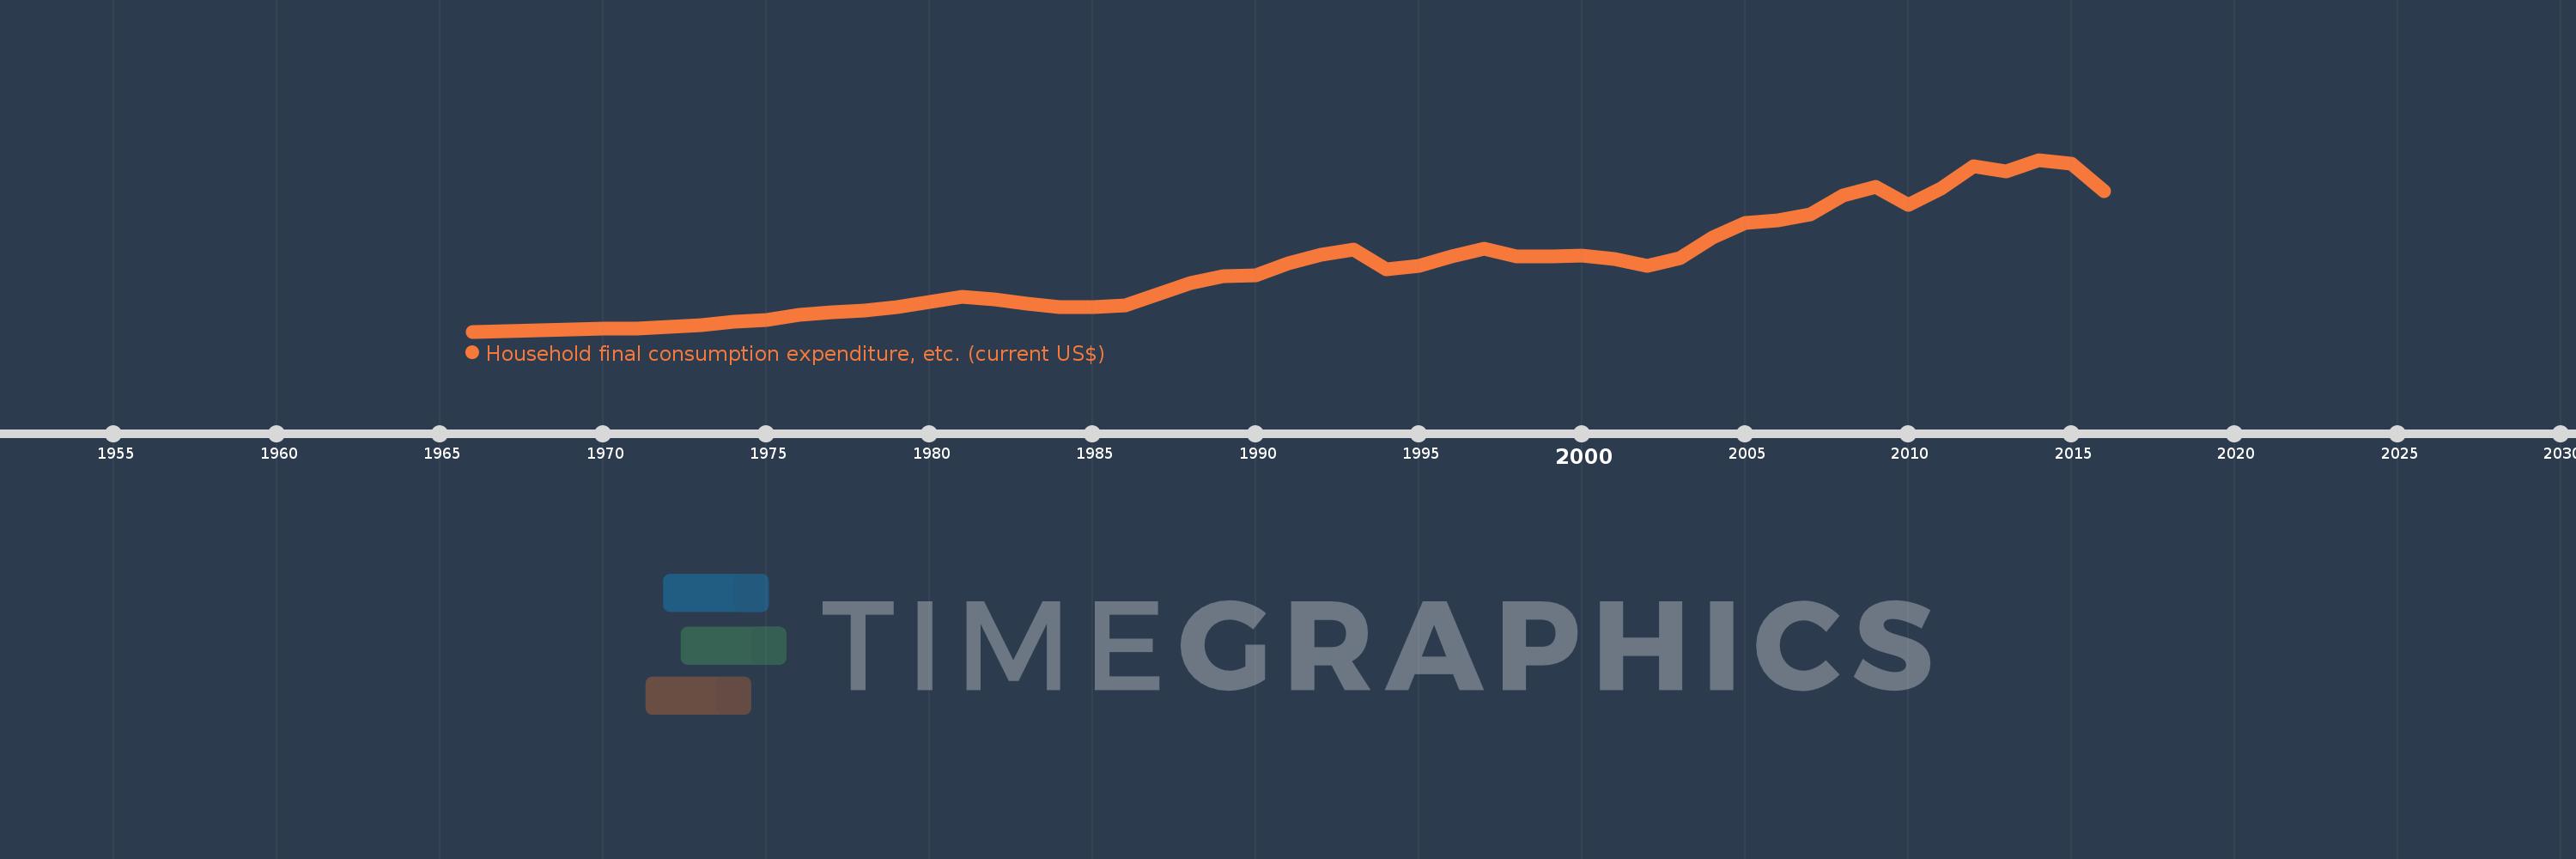
Household final consumption expenditure, etc. (current US$)
2016,2015,2014,2013,2012,2011,2010,2009,2008,2007,2006,2005,2004,2003,2002,2001,2000,1999,1998,1997,1996,1995,1994,1993,1992,1991,1990,1989,1988,1987,1986,1985,1984,1983,1982,1981,1980,1979,1978,1977,1976,1975,1974,1973,1972,1971,1970,1969,1968,1967,1966
This statistics in other country:
AfghanistanAlbaniaAlgeriaAngolaAntigua and BarbudaArab WorldArgentinaArmeniaArubaAustraliaAustriaAzerbaijanBahamas, TheBahrainBangladeshBarbadosBelarusBelgiumBelizeBeninBermudaBhutanBoliviaBosnia and HerzegovinaBotswanaBrazilBrunei DarussalamBulgariaBurkina FasoBurundiCabo VerdeCambodiaCameroonCanadaCaribbean small statesCentral African RepublicCentral Europe and the BalticsChadChileChinaColombiaComorosCongo, Dem. Rep.Congo, Rep.Costa RicaCote d'IvoireCroatiaCubaCyprusCzech RepublicDenmarkDjiboutiDominicaDominican RepublicEarly-demographic dividendEast Asia & PacificEast Asia & Pacific (excluding high income)East Asia & Pacific (IDA & IBRD countries)EcuadorEgypt, Arab Rep.El SalvadorEquatorial GuineaEritreaEstoniaEthiopiaEuro areaEurope & Central AsiaEurope & Central Asia (excluding high income)Europe & Central Asia (IDA & IBRD countries)European UnionFaroe IslandsFijiFinlandFragile and conflict affected situationsFranceGabonGambia, TheGeorgiaGermanyGhanaGreeceGrenadaGuatemalaGuineaGuinea-BissauGuyanaHaitiHeavily indebted poor countries (HIPC)High incomeHondurasHong Kong SAR, ChinaHungaryIBRD onlyIcelandIDA & IBRD totalIDA blendIDA onlyIDA totalIndiaIndonesiaIran, Islamic Rep.IraqIrelandIsraelItalyJamaicaJapanJordanKazakhstanKenyaKiribatiKorea, Rep.KosovoKuwaitKyrgyz RepublicLao PDRLate-demographic dividendLatin America & Caribbean Latin America & Caribbean (excluding high income)Latin America & the Caribbean (IDA & IBRD countries)LatviaLeast developed countries: UN classificationLebanonLesothoLiberiaLibyaLithuaniaLow & middle incomeLow incomeLower middle incomeLuxembourgMacao SAR, ChinaMacedonia, FYRMadagascarMalawiMalaysiaMaldivesMaliMaltaMauritaniaMauritiusMexicoMicronesia, Fed. Sts.Middle East & North AfricaMiddle East & North Africa (excluding high income)Middle East & North Africa (IDA & IBRD countries)Middle incomeMoldovaMongoliaMontenegroMoroccoMozambiqueNamibiaNepalNetherlandsNew CaledoniaNew ZealandNicaraguaNigerNigeriaNorth AmericaNorwayOECD membersOmanOther small statesPakistanPanamaPapua New GuineaParaguayPeruPhilippinesPolandPortugalPost-demographic dividendPre-demographic dividendPuerto RicoQatarRomaniaRussian FederationRwandaSaudi ArabiaSenegalSerbiaSeychellesSierra LeoneSingaporeSlovak RepublicSloveniaSmall statesSolomon IslandsSouth AfricaSouth AsiaSouth Asia (IDA & IBRD)South SudanSpainSri LankaSt. Kitts and NevisSt. LuciaSt. Vincent and the GrenadinesSub-Saharan Africa Sub-Saharan Africa (excluding high income)Sub-Saharan Africa (IDA & IBRD countries)SudanSurinameSwazilandSwedenSwitzerlandSyrian Arab RepublicTajikistanTanzaniaThailandTimor-LesteTogoTongaTrinidad and TobagoTunisiaTurkeyTurkmenistanUgandaUkraineUnited Arab EmiratesUnited KingdomUnited StatesUpper middle incomeUruguayUzbekistanVanuatuVenezuela, RBVietnamWest Bank and GazaWorldYemen, Rep.ZambiaZimbabwe Timeline:
This timeline shows a graph from 1966 to 2016 of Sweden. No data until 1965. Number of actual observations by date: 51.
Source name:
World Development Indicators
Source organization:
World Bank national accounts data, and OECD National Accounts data files.
Categories, topics:
Economy & Growth
Last updated:
apr 23, 2017
Indicators value changes by year
Minimum:
12.684 bln
jan 1, 1966
Maximum:
270.082 bln
jan 1, 2014
At the date of observation
Value
Absolute change
Change from previous value
jan 1, 1966
12.684 bln
+12.684 bln
0.0%
jan 1, 1967
13.84 bln
+1.156 bln
9.12%
jan 1, 1968
14.971 bln
+1.13 bln
8.17%
jan 1, 1969
15.854 bln
+882.942 mln
5.9%
jan 1, 1970
17.054 bln
+1.2 bln
7.57%
jan 1, 1971
17.382 bln
+328.317 mln
1.93%
jan 1, 1972
19.191 bln
+1.808 bln
10.4%
jan 1, 1973
22.853 bln
+3.662 bln
19.08%
jan 1, 1974
27.623 bln
+4.77 bln
20.87%
jan 1, 1975
30.577 bln
+2.954 bln
10.69%
jan 1, 1976
37.17 bln
+6.593 bln
21.56%
jan 1, 1977
41.18 bln
+4.01 bln
10.79%
jan 1, 1978
44.677 bln
+3.497 bln
8.49%
jan 1, 1979
49.95 bln
+5.273 bln
11.8%
jan 1, 1980
57.432 bln
+7.482 bln
14.98%
jan 1, 1981
64.669 bln
+7.237 bln
12.6%
jan 1, 1982
61.335 bln
-3.333 bln
-5.15%
jan 1, 1983
55.118 bln
-6.217 bln
-10.14%
jan 1, 1984
49.005 bln
-6.113 bln
-11.09%
jan 1, 1985
49.358 bln
+353.214 mln
0.72%
jan 1, 1986
51.431 bln
+2.073 bln
4.2%
jan 1, 1987
68.916 bln
+17.485 bln
34.0%
jan 1, 1988
85.189 bln
+16.273 bln
23.61%
jan 1, 1989
95.609 bln
+10.42 bln
12.23%
jan 1, 1990
96.625 bln
+1.016 bln
1.06%
jan 1, 1991
115.233 bln
+18.608 bln
19.26%
jan 1, 1992
127.804 bln
+12.571 bln
10.91%
jan 1, 1993
135.023 bln
+7.22 bln
5.65%
jan 1, 1994
105.367 bln
-29.657 bln
-21.96%
jan 1, 1995
111.285 bln
+5.918 bln
5.62%
jan 1, 1996
125.286 bln
+14.001 bln
12.58%
jan 1, 1997
136.927 bln
+11.641 bln
9.29%
jan 1, 1998
125.425 bln
-11.501 bln
-8.4%
jan 1, 1999
125.0 bln
-425.921 mln
-0.34%
jan 1, 2000
126.965 bln
+1.965 bln
1.57%
jan 1, 2001
121.692 bln
-5.273 bln
-4.15%
jan 1, 2002
111.073 bln
-10.619 bln
-8.73%
jan 1, 2003
122.642 bln
+11.569 bln
10.42%
jan 1, 2004
153.546 bln
+30.905 bln
25.2%
jan 1, 2005
175.018 bln
+21.472 bln
13.98%
jan 1, 2006
178.835 bln
+3.817 bln
2.18%
jan 1, 2007
188.213 bln
+9.379 bln
5.24%
jan 1, 2008
216.342 bln
+28.129 bln
14.95%
jan 1, 2009
229.295 bln
+12.952 bln
5.99%
jan 1, 2010
202.564 bln
-26.73 bln
-11.66%
jan 1, 2011
226.797 bln
+24.233 bln
11.96%
jan 1, 2012
260.706 bln
+33.909 bln
14.95%
jan 1, 2013
253.14 bln
-7.566 bln
-2.9%
jan 1, 2014
270.082 bln
+16.942 bln
6.69%
jan 1, 2015
264.719 bln
-5.363 bln
-1.99%
jan 1, 2016
223.379 bln
-41.34 bln
-15.62%
Ranking of countries by current statistics by years


Comments: