29
/
en
AIzaSyAYiBZKx7MnpbEhh9jyipgxe19OcubqV5w
April 1, 2024
172950
Kyrgyz Republic
KGZ
true
2
1
Household final consumption expenditure, etc. (current US$)
2016,2015,2014,2013,2012,2011,2010,2009,2008,2007,2006,2005,2004,2003,2002,2001,2000,1999,1998,1997,1996,1995,1994,1993,1992,1991
This statistics in other country:
AfghanistanAlbaniaAlgeriaAngolaAntigua and BarbudaArab WorldArgentinaArmeniaArubaAustraliaAustriaAzerbaijanBahamas, TheBahrainBangladeshBarbadosBelarusBelgiumBelizeBeninBermudaBhutanBoliviaBosnia and HerzegovinaBotswanaBrazilBrunei DarussalamBulgariaBurkina FasoBurundiCabo VerdeCambodiaCameroonCanadaCaribbean small statesCentral African RepublicCentral Europe and the BalticsChadChileChinaColombiaComorosCongo, Dem. Rep.Congo, Rep.Costa RicaCote d'IvoireCroatiaCubaCyprusCzech RepublicDenmarkDjiboutiDominicaDominican RepublicEarly-demographic dividendEast Asia & PacificEast Asia & Pacific (excluding high income)East Asia & Pacific (IDA & IBRD countries)EcuadorEgypt, Arab Rep.El SalvadorEquatorial GuineaEritreaEstoniaEthiopiaEuro areaEurope & Central AsiaEurope & Central Asia (excluding high income)Europe & Central Asia (IDA & IBRD countries)European UnionFaroe IslandsFijiFinlandFragile and conflict affected situationsFranceGabonGambia, TheGeorgiaGermanyGhanaGreeceGrenadaGuatemalaGuineaGuinea-BissauGuyanaHaitiHeavily indebted poor countries (HIPC)High incomeHondurasHong Kong SAR, ChinaHungaryIBRD onlyIcelandIDA & IBRD totalIDA blendIDA onlyIDA totalIndiaIndonesiaIran, Islamic Rep.IraqIrelandIsraelItalyJamaicaJapanJordanKazakhstanKenyaKiribatiKorea, Rep.KosovoKuwaitKyrgyz RepublicLao PDRLate-demographic dividendLatin America & Caribbean Latin America & Caribbean (excluding high income)Latin America & the Caribbean (IDA & IBRD countries)LatviaLeast developed countries: UN classificationLebanonLesothoLiberiaLibyaLithuaniaLow & middle incomeLow incomeLower middle incomeLuxembourgMacao SAR, ChinaMacedonia, FYRMadagascarMalawiMalaysiaMaldivesMaliMaltaMauritaniaMauritiusMexicoMicronesia, Fed. Sts.Middle East & North AfricaMiddle East & North Africa (excluding high income)Middle East & North Africa (IDA & IBRD countries)Middle incomeMoldovaMongoliaMontenegroMoroccoMozambiqueNamibiaNepalNetherlandsNew CaledoniaNew ZealandNicaraguaNigerNigeriaNorth AmericaNorwayOECD membersOmanOther small statesPakistanPanamaPapua New GuineaParaguayPeruPhilippinesPolandPortugalPost-demographic dividendPre-demographic dividendPuerto RicoQatarRomaniaRussian FederationRwandaSaudi ArabiaSenegalSerbiaSeychellesSierra LeoneSingaporeSlovak RepublicSloveniaSmall statesSolomon IslandsSouth AfricaSouth AsiaSouth Asia (IDA & IBRD)South SudanSpainSri LankaSt. Kitts and NevisSt. LuciaSt. Vincent and the GrenadinesSub-Saharan Africa Sub-Saharan Africa (excluding high income)Sub-Saharan Africa (IDA & IBRD countries)SudanSurinameSwazilandSwedenSwitzerlandSyrian Arab RepublicTajikistanTanzaniaThailandTimor-LesteTogoTongaTrinidad and TobagoTunisiaTurkeyTurkmenistanUgandaUkraineUnited Arab EmiratesUnited KingdomUnited StatesUpper middle incomeUruguayUzbekistanVanuatuVenezuela, RBVietnamWest Bank and GazaWorldYemen, Rep.ZambiaZimbabwe Timeline:
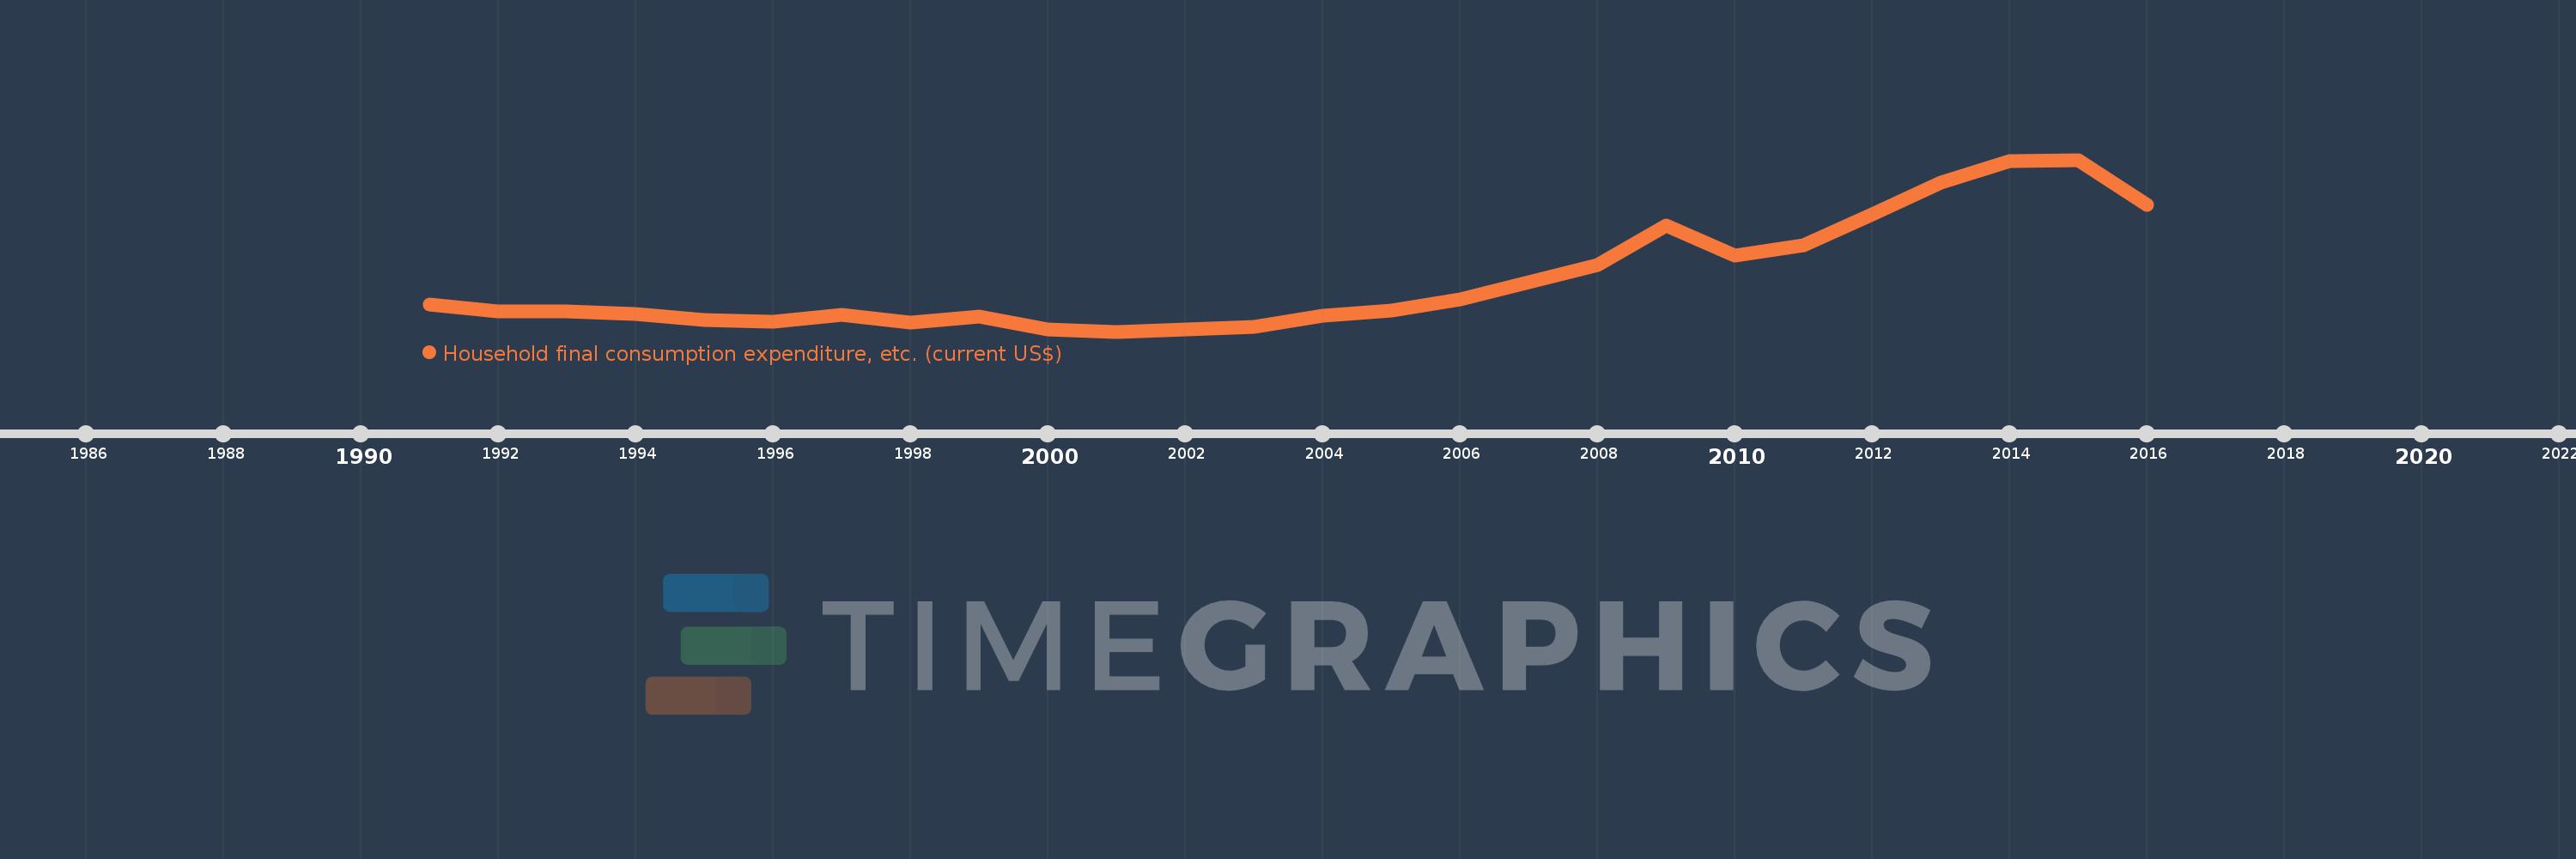
This timeline shows a graph from 1991 to 2016 of Kyrgyz Republic. No data until 1990. Number of actual observations by date: 26.
Source name:
World Development Indicators
Source organization:
World Bank national accounts data, and OECD National Accounts data files.
Categories, topics:
Economy & Growth
Last updated:
apr 23, 2017
Indicators value changes by year
Minimum:
899.668 mln
jan 1, 2001
Maximum:
7.169 bln
jan 1, 2015
At the date of observation
Value
Absolute change
Change from previous value
jan 1, 1991
1.902 bln
+1.902 bln
0.0%
jan 1, 1992
1.648 bln
-254.688 mln
-13.39%
jan 1, 1993
1.639 bln
-9.172 mln
-0.56%
jan 1, 1994
1.535 bln
-103.317 mln
-6.31%
jan 1, 1995
1.318 bln
-217.549 mln
-14.17%
jan 1, 1996
1.246 bln
-71.727 mln
-5.44%
jan 1, 1997
1.501 bln
+254.527 mln
20.43%
jan 1, 1998
1.219 bln
-281.966 mln
-18.79%
jan 1, 1999
1.452 bln
+233.917 mln
19.2%
jan 1, 2000
969.858 mln
-482.605 mln
-33.23%
jan 1, 2001
899.668 mln
-70.19 mln
-7.24%
jan 1, 2002
988.618 mln
+88.95 mln
9.89%
jan 1, 2003
1.084 bln
+95.705 mln
9.68%
jan 1, 2004
1.495 bln
+410.772 mln
37.88%
jan 1, 2005
1.682 bln
+186.621 mln
12.48%
jan 1, 2006
2.08 bln
+398.298 mln
23.68%
jan 1, 2007
2.696 bln
+616.008 mln
29.62%
jan 1, 2008
3.327 bln
+630.707 mln
23.39%
jan 1, 2009
4.756 bln
+1.43 bln
42.98%
jan 1, 2010
3.671 bln
-1.085 bln
-22.81%
jan 1, 2011
4.056 bln
+384.406 mln
10.47%
jan 1, 2012
5.169 bln
+1.113 bln
27.45%
jan 1, 2013
6.328 bln
+1.159 bln
22.42%
jan 1, 2014
7.128 bln
+800.463 mln
12.65%
jan 1, 2015
7.169 bln
+41.057 mln
0.58%
jan 1, 2016
5.509 bln
-1.66 bln
-23.15%
Ranking of countries by current statistics by years


Comments: