29
/
en
AIzaSyAYiBZKx7MnpbEhh9jyipgxe19OcubqV5w
April 1, 2024
143075
Grenada
GRD
true
2
1
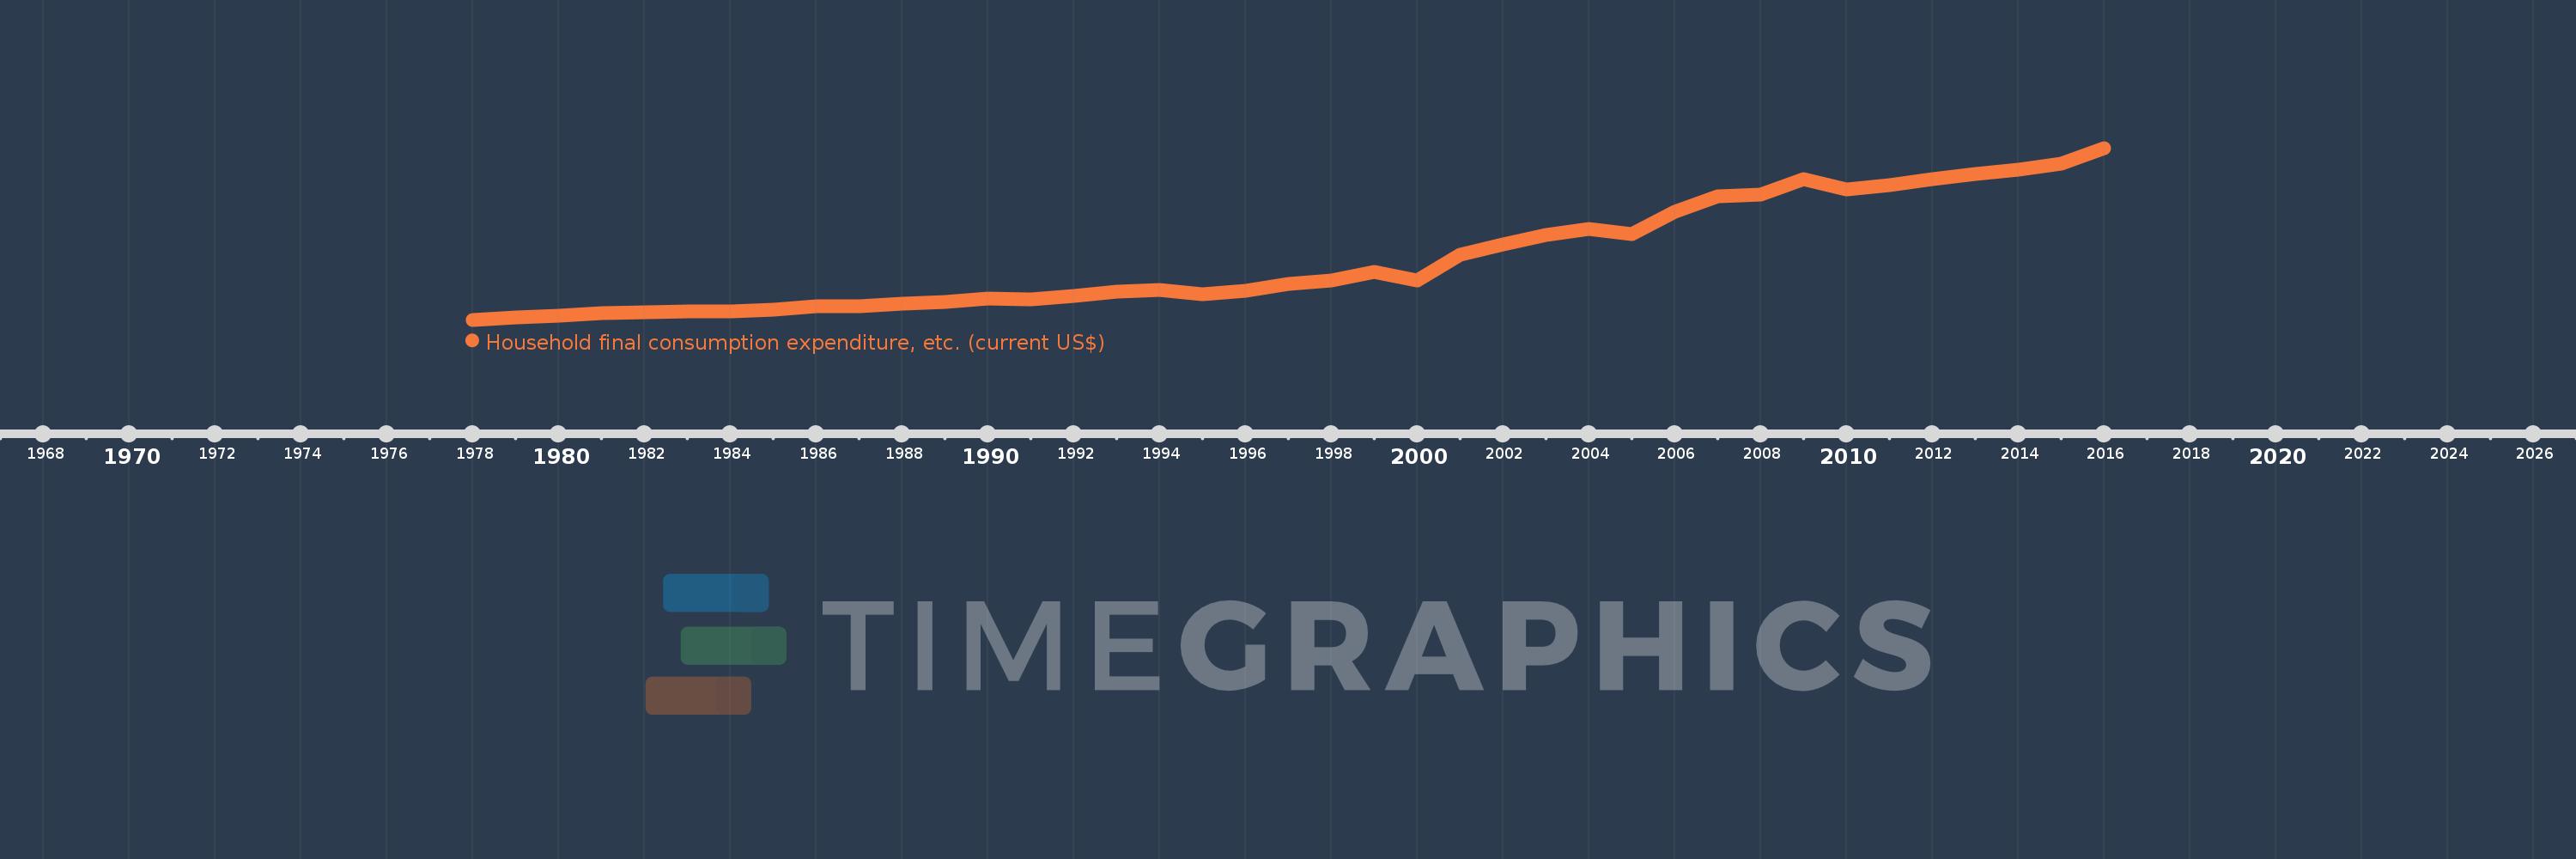
Household final consumption expenditure, etc. (current US$)
2016,2015,2014,2013,2012,2011,2010,2009,2008,2007,2006,2005,2004,2003,2002,2001,2000,1999,1998,1997,1996,1995,1994,1993,1992,1991,1990,1989,1988,1987,1986,1985,1984,1983,1982,1981,1980,1979,1978
This statistics in other country:
AfghanistanAlbaniaAlgeriaAngolaAntigua and BarbudaArab WorldArgentinaArmeniaArubaAustraliaAustriaAzerbaijanBahamas, TheBahrainBangladeshBarbadosBelarusBelgiumBelizeBeninBermudaBhutanBoliviaBosnia and HerzegovinaBotswanaBrazilBrunei DarussalamBulgariaBurkina FasoBurundiCabo VerdeCambodiaCameroonCanadaCaribbean small statesCentral African RepublicCentral Europe and the BalticsChadChileChinaColombiaComorosCongo, Dem. Rep.Congo, Rep.Costa RicaCote d'IvoireCroatiaCubaCyprusCzech RepublicDenmarkDjiboutiDominicaDominican RepublicEarly-demographic dividendEast Asia & PacificEast Asia & Pacific (excluding high income)East Asia & Pacific (IDA & IBRD countries)EcuadorEgypt, Arab Rep.El SalvadorEquatorial GuineaEritreaEstoniaEthiopiaEuro areaEurope & Central AsiaEurope & Central Asia (excluding high income)Europe & Central Asia (IDA & IBRD countries)European UnionFaroe IslandsFijiFinlandFragile and conflict affected situationsFranceGabonGambia, TheGeorgiaGermanyGhanaGreeceGrenadaGuatemalaGuineaGuinea-BissauGuyanaHaitiHeavily indebted poor countries (HIPC)High incomeHondurasHong Kong SAR, ChinaHungaryIBRD onlyIcelandIDA & IBRD totalIDA blendIDA onlyIDA totalIndiaIndonesiaIran, Islamic Rep.IraqIrelandIsraelItalyJamaicaJapanJordanKazakhstanKenyaKiribatiKorea, Rep.KosovoKuwaitKyrgyz RepublicLao PDRLate-demographic dividendLatin America & Caribbean Latin America & Caribbean (excluding high income)Latin America & the Caribbean (IDA & IBRD countries)LatviaLeast developed countries: UN classificationLebanonLesothoLiberiaLibyaLithuaniaLow & middle incomeLow incomeLower middle incomeLuxembourgMacao SAR, ChinaMacedonia, FYRMadagascarMalawiMalaysiaMaldivesMaliMaltaMauritaniaMauritiusMexicoMicronesia, Fed. Sts.Middle East & North AfricaMiddle East & North Africa (excluding high income)Middle East & North Africa (IDA & IBRD countries)Middle incomeMoldovaMongoliaMontenegroMoroccoMozambiqueNamibiaNepalNetherlandsNew CaledoniaNew ZealandNicaraguaNigerNigeriaNorth AmericaNorwayOECD membersOmanOther small statesPakistanPanamaPapua New GuineaParaguayPeruPhilippinesPolandPortugalPost-demographic dividendPre-demographic dividendPuerto RicoQatarRomaniaRussian FederationRwandaSaudi ArabiaSenegalSerbiaSeychellesSierra LeoneSingaporeSlovak RepublicSloveniaSmall statesSolomon IslandsSouth AfricaSouth AsiaSouth Asia (IDA & IBRD)South SudanSpainSri LankaSt. Kitts and NevisSt. LuciaSt. Vincent and the GrenadinesSub-Saharan Africa Sub-Saharan Africa (excluding high income)Sub-Saharan Africa (IDA & IBRD countries)SudanSurinameSwazilandSwedenSwitzerlandSyrian Arab RepublicTajikistanTanzaniaThailandTimor-LesteTogoTongaTrinidad and TobagoTunisiaTurkeyTurkmenistanUgandaUkraineUnited Arab EmiratesUnited KingdomUnited StatesUpper middle incomeUruguayUzbekistanVanuatuVenezuela, RBVietnamWest Bank and GazaWorldYemen, Rep.ZambiaZimbabwe Timeline:
This timeline shows a graph from 1978 to 2016 of Grenada. No data until 1977. Number of actual observations by date: 39.
Source name:
World Development Indicators
Source organization:
World Bank national accounts data, and OECD National Accounts data files.
Categories, topics:
Economy & Growth
Last updated:
apr 23, 2017
Indicators value changes by year
Minimum:
40.807 mln
jan 1, 1978
Maximum:
819.126 mln
jan 1, 2016
At the date of observation
Value
Absolute change
Change from previous value
jan 1, 1978
40.807 mln
+40.807 mln
0.0%
jan 1, 1979
49.763 mln
+8.956 mln
21.95%
jan 1, 1980
58.815 mln
+9.052 mln
18.19%
jan 1, 1981
70.707 mln
+11.893 mln
20.22%
jan 1, 1982
73.267 mln
+2.559 mln
3.62%
jan 1, 1983
78.441 mln
+5.174 mln
7.06%
jan 1, 1984
77.881 mln
-559.259K
-0.71%
jan 1, 1985
86.467 mln
+8.585 mln
11.02%
jan 1, 1986
102.078 mln
+15.611 mln
18.05%
jan 1, 1987
103.615 mln
+1.537 mln
1.51%
jan 1, 1988
112.433 mln
+8.819 mln
8.51%
jan 1, 1989
120.57 mln
+8.137 mln
7.24%
jan 1, 1990
135.326 mln
+14.756 mln
12.24%
jan 1, 1991
134.111 mln
-1.215 mln
-0.9%
jan 1, 1992
150.048 mln
+15.937 mln
11.88%
jan 1, 1993
168.756 mln
+18.707 mln
12.47%
jan 1, 1994
174.181 mln
+5.426 mln
3.22%
jan 1, 1995
157.889 mln
-16.293 mln
-9.35%
jan 1, 1996
170.752 mln
+12.863 mln
8.15%
jan 1, 1997
204.141 mln
+33.389 mln
19.55%
jan 1, 1998
217.274 mln
+13.133 mln
6.43%
jan 1, 1999
255.991 mln
+38.717 mln
17.82%
jan 1, 2000
220.578 mln
-35.414 mln
-13.83%
jan 1, 2001
336.367 mln
+115.789 mln
52.49%
jan 1, 2002
380.447 mln
+44.081 mln
13.11%
jan 1, 2003
423.53 mln
+43.083 mln
11.32%
jan 1, 2004
451.201 mln
+27.671 mln
6.53%
jan 1, 2005
428.966 mln
-22.235 mln
-4.93%
jan 1, 2006
530.052 mln
+101.086 mln
23.57%
jan 1, 2007
598.585 mln
+68.534 mln
12.93%
jan 1, 2008
606.196 mln
+7.611 mln
1.27%
jan 1, 2009
676.563 mln
+70.366 mln
11.61%
jan 1, 2010
630.35 mln
-46.212 mln
-6.83%
jan 1, 2011
651.459 mln
+21.109 mln
3.35%
jan 1, 2012
676.015 mln
+24.555 mln
3.77%
jan 1, 2013
703.118 mln
+27.104 mln
4.01%
jan 1, 2014
720.232 mln
+17.114 mln
2.43%
jan 1, 2015
749.719 mln
+29.487 mln
4.09%
jan 1, 2016
819.126 mln
+69.406 mln
9.26%
Ranking of countries by current statistics by years


Comments: