29
/
en
AIzaSyAYiBZKx7MnpbEhh9jyipgxe19OcubqV5w
April 1, 2024
140492
Ghana
GHA
true
2
1
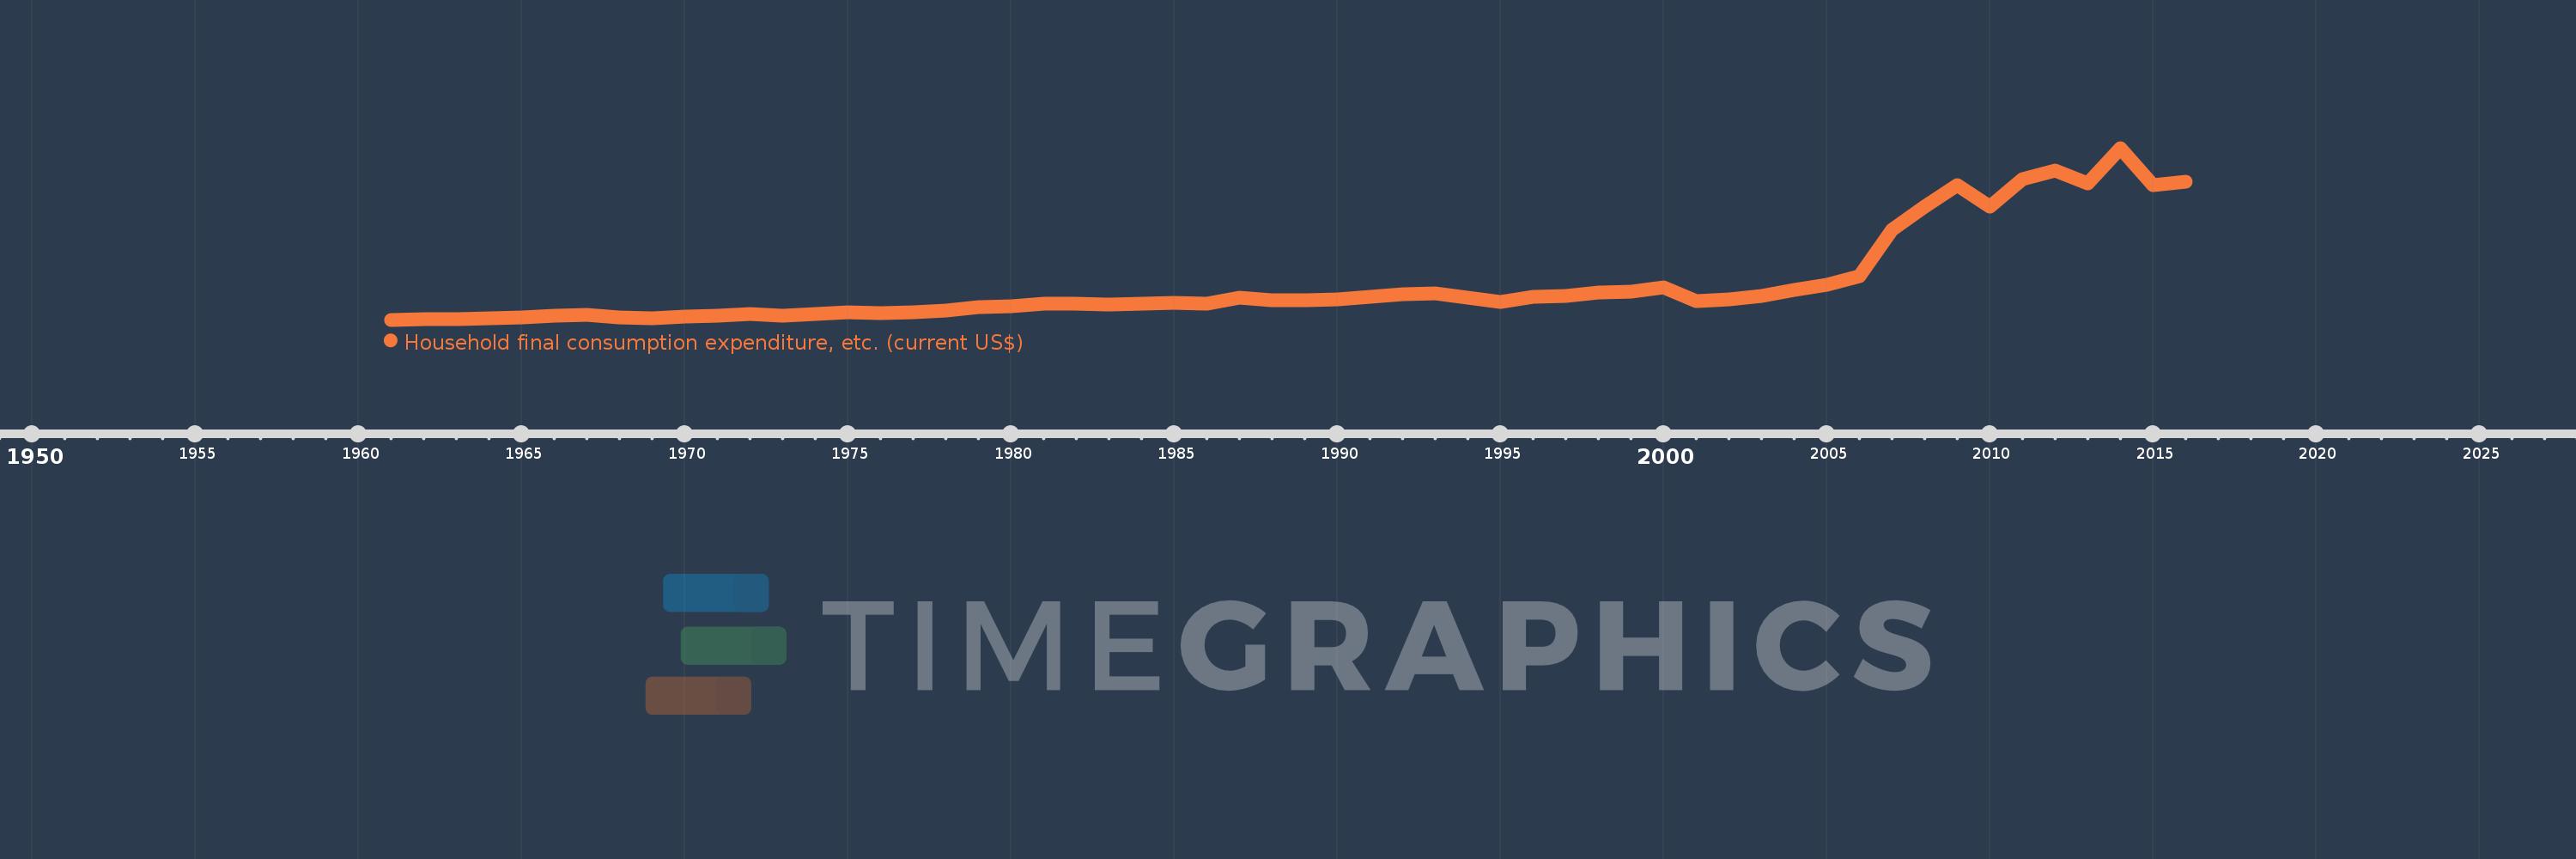
Household final consumption expenditure, etc. (current US$)
2016,2015,2014,2013,2012,2011,2010,2009,2008,2007,2006,2005,2004,2003,2002,2001,2000,1999,1998,1997,1996,1995,1994,1993,1992,1991,1990,1989,1988,1987,1986,1985,1984,1983,1982,1981,1980,1979,1978,1977,1976,1975,1974,1973,1972,1971,1970,1969,1968,1967,1966,1965,1964,1963,1962,1961
This statistics in other country:
AfghanistanAlbaniaAlgeriaAngolaAntigua and BarbudaArab WorldArgentinaArmeniaArubaAustraliaAustriaAzerbaijanBahamas, TheBahrainBangladeshBarbadosBelarusBelgiumBelizeBeninBermudaBhutanBoliviaBosnia and HerzegovinaBotswanaBrazilBrunei DarussalamBulgariaBurkina FasoBurundiCabo VerdeCambodiaCameroonCanadaCaribbean small statesCentral African RepublicCentral Europe and the BalticsChadChileChinaColombiaComorosCongo, Dem. Rep.Congo, Rep.Costa RicaCote d'IvoireCroatiaCubaCyprusCzech RepublicDenmarkDjiboutiDominicaDominican RepublicEarly-demographic dividendEast Asia & PacificEast Asia & Pacific (excluding high income)East Asia & Pacific (IDA & IBRD countries)EcuadorEgypt, Arab Rep.El SalvadorEquatorial GuineaEritreaEstoniaEthiopiaEuro areaEurope & Central AsiaEurope & Central Asia (excluding high income)Europe & Central Asia (IDA & IBRD countries)European UnionFaroe IslandsFijiFinlandFragile and conflict affected situationsFranceGabonGambia, TheGeorgiaGermanyGhanaGreeceGrenadaGuatemalaGuineaGuinea-BissauGuyanaHaitiHeavily indebted poor countries (HIPC)High incomeHondurasHong Kong SAR, ChinaHungaryIBRD onlyIcelandIDA & IBRD totalIDA blendIDA onlyIDA totalIndiaIndonesiaIran, Islamic Rep.IraqIrelandIsraelItalyJamaicaJapanJordanKazakhstanKenyaKiribatiKorea, Rep.KosovoKuwaitKyrgyz RepublicLao PDRLate-demographic dividendLatin America & Caribbean Latin America & Caribbean (excluding high income)Latin America & the Caribbean (IDA & IBRD countries)LatviaLeast developed countries: UN classificationLebanonLesothoLiberiaLibyaLithuaniaLow & middle incomeLow incomeLower middle incomeLuxembourgMacao SAR, ChinaMacedonia, FYRMadagascarMalawiMalaysiaMaldivesMaliMaltaMauritaniaMauritiusMexicoMicronesia, Fed. Sts.Middle East & North AfricaMiddle East & North Africa (excluding high income)Middle East & North Africa (IDA & IBRD countries)Middle incomeMoldovaMongoliaMontenegroMoroccoMozambiqueNamibiaNepalNetherlandsNew CaledoniaNew ZealandNicaraguaNigerNigeriaNorth AmericaNorwayOECD membersOmanOther small statesPakistanPanamaPapua New GuineaParaguayPeruPhilippinesPolandPortugalPost-demographic dividendPre-demographic dividendPuerto RicoQatarRomaniaRussian FederationRwandaSaudi ArabiaSenegalSerbiaSeychellesSierra LeoneSingaporeSlovak RepublicSloveniaSmall statesSolomon IslandsSouth AfricaSouth AsiaSouth Asia (IDA & IBRD)South SudanSpainSri LankaSt. Kitts and NevisSt. LuciaSt. Vincent and the GrenadinesSub-Saharan Africa Sub-Saharan Africa (excluding high income)Sub-Saharan Africa (IDA & IBRD countries)SudanSurinameSwazilandSwedenSwitzerlandSyrian Arab RepublicTajikistanTanzaniaThailandTimor-LesteTogoTongaTrinidad and TobagoTunisiaTurkeyTurkmenistanUgandaUkraineUnited Arab EmiratesUnited KingdomUnited StatesUpper middle incomeUruguayUzbekistanVanuatuVenezuela, RBVietnamWest Bank and GazaWorldYemen, Rep.ZambiaZimbabwe Timeline:
This timeline shows a graph from 1961 to 2016 of Ghana. No data until 1960. Number of actual observations by date: 56.
Source name:
World Development Indicators
Source organization:
World Bank national accounts data, and OECD National Accounts data files.
Categories, topics:
Economy & Growth
Last updated:
apr 23, 2017
Indicators value changes by year
Minimum:
886.659 mln
jan 1, 1961
Maximum:
31.372 bln
jan 1, 2014
At the date of observation
Value
Absolute change
Change from previous value
jan 1, 1961
886.659 mln
+886.659 mln
0.0%
jan 1, 1962
1.034 bln
+147.076 mln
16.59%
jan 1, 1963
1.062 bln
+28.015 mln
2.71%
jan 1, 1964
1.174 bln
+112.058 mln
10.55%
jan 1, 1965
1.259 bln
+85.444 mln
7.28%
jan 1, 1966
1.587 bln
+327.77 mln
26.03%
jan 1, 1967
1.682 bln
+95.249 mln
6.0%
jan 1, 1968
1.35 bln
-332.382 mln
-19.76%
jan 1, 1969
1.21 bln
-139.908 mln
-10.36%
jan 1, 1970
1.463 bln
+252.978 mln
20.91%
jan 1, 1971
1.647 bln
+184.341 mln
12.6%
jan 1, 1972
1.871 bln
+223.543 mln
13.57%
jan 1, 1973
1.58 bln
-291.312 mln
-15.57%
jan 1, 1974
1.849 bln
+269.766 mln
17.08%
jan 1, 1975
2.264 bln
+414.679 mln
22.42%
jan 1, 1976
2.061 bln
-203.337 mln
-8.98%
jan 1, 1977
2.19 bln
+129.616 mln
6.29%
jan 1, 1978
2.467 bln
+277.174 mln
12.65%
jan 1, 1979
3.101 bln
+633.095 mln
25.66%
jan 1, 1980
3.341 bln
+240.502 mln
7.76%
jan 1, 1981
3.73 bln
+388.539 mln
11.63%
jan 1, 1982
3.682 bln
-47.413 mln
-1.27%
jan 1, 1983
3.624 bln
-58.435 mln
-1.59%
jan 1, 1984
3.685 bln
+61.182 mln
1.69%
jan 1, 1985
3.909 bln
+223.957 mln
6.08%
jan 1, 1986
3.782 bln
-126.722 mln
-3.24%
jan 1, 1987
4.761 bln
+979.245 mln
25.89%
jan 1, 1988
4.337 bln
-424.705 mln
-8.92%
jan 1, 1989
4.412 bln
+74.981 mln
1.73%
jan 1, 1990
4.44 bln
+28.544 mln
0.65%
jan 1, 1991
5.019 bln
+578.372 mln
13.03%
jan 1, 1992
5.488 bln
+469.698 mln
9.36%
jan 1, 1993
5.557 bln
+68.358 mln
1.25%
jan 1, 1994
4.743 bln
-813.35 mln
-14.64%
jan 1, 1995
4.019 bln
-723.95 mln
-15.26%
jan 1, 1996
4.935 bln
+915.855 mln
22.79%
jan 1, 1997
5.183 bln
+247.808 mln
5.02%
jan 1, 1998
5.749 bln
+565.698 mln
10.91%
jan 1, 1999
5.942 bln
+192.943 mln
3.36%
jan 1, 2000
6.616 bln
+674.206 mln
11.35%
jan 1, 2001
4.199 bln
-2.416 bln
-36.53%
jan 1, 2002
4.425 bln
+225.711 mln
5.37%
jan 1, 2003
5.099 bln
+673.477 mln
15.22%
jan 1, 2004
6.217 bln
+1.119 bln
21.94%
jan 1, 2005
7.151 bln
+933.412 mln
15.01%
jan 1, 2006
8.689 bln
+1.538 bln
21.51%
jan 1, 2007
16.858 bln
+8.169 bln
94.02%
jan 1, 2008
20.955 bln
+4.098 bln
24.31%
jan 1, 2009
24.75 bln
+3.795 bln
18.11%
jan 1, 2010
20.94 bln
-3.81 bln
-15.4%
jan 1, 2011
25.763 bln
+4.824 bln
23.04%
jan 1, 2012
27.435 bln
+1.672 bln
6.49%
jan 1, 2013
25.07 bln
-2.365 bln
-8.62%
jan 1, 2014
31.372 bln
+6.301 bln
25.14%
jan 1, 2015
24.827 bln
-6.545 bln
-20.86%
jan 1, 2016
25.44 bln
+613.051 mln
2.47%
Ranking of countries by current statistics by years


Comments: