29
/
en
AIzaSyAYiBZKx7MnpbEhh9jyipgxe19OcubqV5w
April 1, 2024
53473
Other small states
OSS
false
2
1
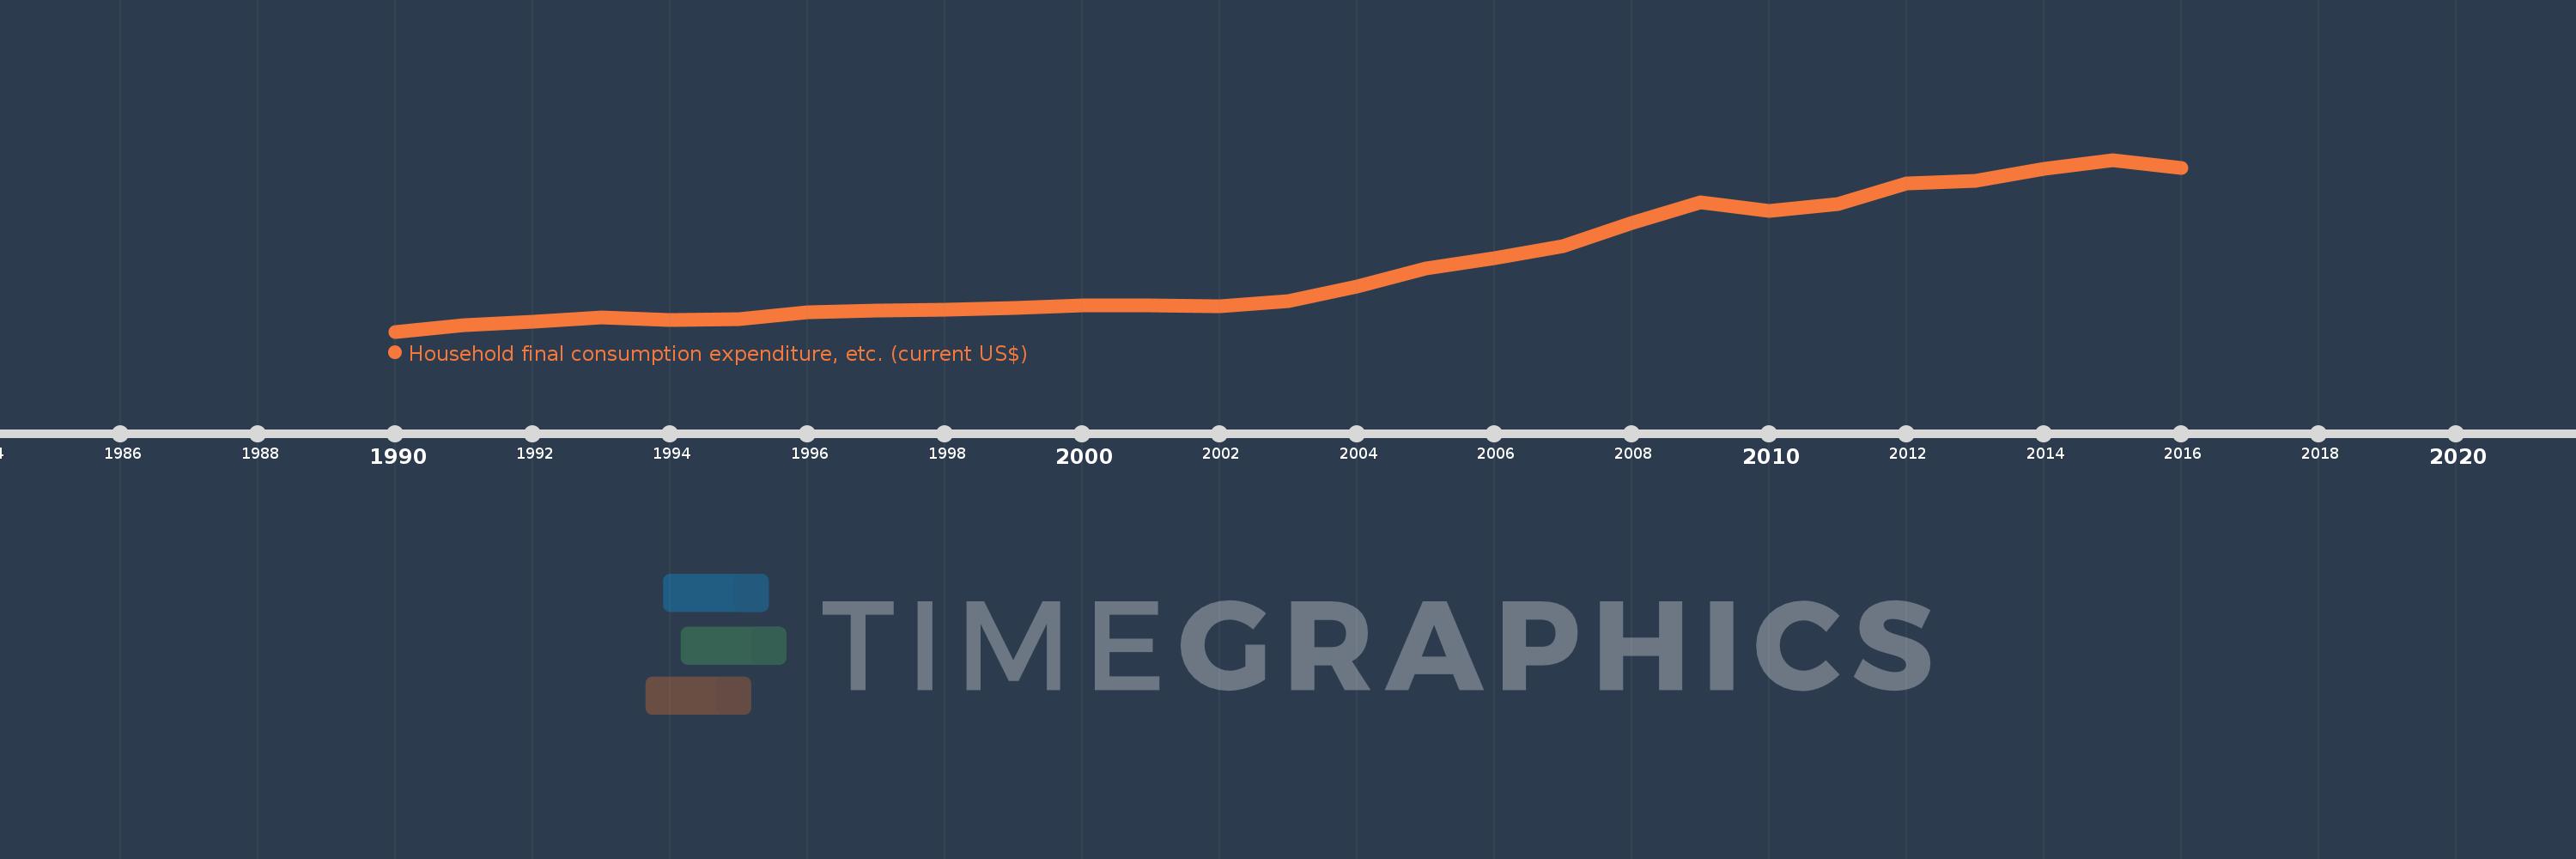
Household final consumption expenditure, etc. (current US$)
2016,2015,2014,2013,2012,2011,2010,2009,2008,2007,2006,2005,2004,2003,2002,2001,2000,1999,1998,1997,1996,1995,1994,1993,1992,1991,1990
This statistics in other country:
AfghanistanAlbaniaAlgeriaAngolaAntigua and BarbudaArab WorldArgentinaArmeniaArubaAustraliaAustriaAzerbaijanBahamas, TheBahrainBangladeshBarbadosBelarusBelgiumBelizeBeninBermudaBhutanBoliviaBosnia and HerzegovinaBotswanaBrazilBrunei DarussalamBulgariaBurkina FasoBurundiCabo VerdeCambodiaCameroonCanadaCaribbean small statesCentral African RepublicCentral Europe and the BalticsChadChileChinaColombiaComorosCongo, Dem. Rep.Congo, Rep.Costa RicaCote d'IvoireCroatiaCubaCyprusCzech RepublicDenmarkDjiboutiDominicaDominican RepublicEarly-demographic dividendEast Asia & PacificEast Asia & Pacific (excluding high income)East Asia & Pacific (IDA & IBRD countries)EcuadorEgypt, Arab Rep.El SalvadorEquatorial GuineaEritreaEstoniaEthiopiaEuro areaEurope & Central AsiaEurope & Central Asia (excluding high income)Europe & Central Asia (IDA & IBRD countries)European UnionFaroe IslandsFijiFinlandFragile and conflict affected situationsFranceGabonGambia, TheGeorgiaGermanyGhanaGreeceGrenadaGuatemalaGuineaGuinea-BissauGuyanaHaitiHeavily indebted poor countries (HIPC)High incomeHondurasHong Kong SAR, ChinaHungaryIBRD onlyIcelandIDA & IBRD totalIDA blendIDA onlyIDA totalIndiaIndonesiaIran, Islamic Rep.IraqIrelandIsraelItalyJamaicaJapanJordanKazakhstanKenyaKiribatiKorea, Rep.KosovoKuwaitKyrgyz RepublicLao PDRLate-demographic dividendLatin America & Caribbean Latin America & Caribbean (excluding high income)Latin America & the Caribbean (IDA & IBRD countries)LatviaLeast developed countries: UN classificationLebanonLesothoLiberiaLibyaLithuaniaLow & middle incomeLow incomeLower middle incomeLuxembourgMacao SAR, ChinaMacedonia, FYRMadagascarMalawiMalaysiaMaldivesMaliMaltaMauritaniaMauritiusMexicoMicronesia, Fed. Sts.Middle East & North AfricaMiddle East & North Africa (excluding high income)Middle East & North Africa (IDA & IBRD countries)Middle incomeMoldovaMongoliaMontenegroMoroccoMozambiqueNamibiaNepalNetherlandsNew CaledoniaNew ZealandNicaraguaNigerNigeriaNorth AmericaNorwayOECD membersOmanOther small statesPakistanPanamaPapua New GuineaParaguayPeruPhilippinesPolandPortugalPost-demographic dividendPre-demographic dividendPuerto RicoQatarRomaniaRussian FederationRwandaSaudi ArabiaSenegalSerbiaSeychellesSierra LeoneSingaporeSlovak RepublicSloveniaSmall statesSolomon IslandsSouth AfricaSouth AsiaSouth Asia (IDA & IBRD)South SudanSpainSri LankaSt. Kitts and NevisSt. LuciaSt. Vincent and the GrenadinesSub-Saharan Africa Sub-Saharan Africa (excluding high income)Sub-Saharan Africa (IDA & IBRD countries)SudanSurinameSwazilandSwedenSwitzerlandSyrian Arab RepublicTajikistanTanzaniaThailandTimor-LesteTogoTongaTrinidad and TobagoTunisiaTurkeyTurkmenistanUgandaUkraineUnited Arab EmiratesUnited KingdomUnited StatesUpper middle incomeUruguayUzbekistanVanuatuVenezuela, RBVietnamWest Bank and GazaWorldYemen, Rep.ZambiaZimbabwe Timeline:
This timeline shows a graph from 1990 to 2016 of Other small states. No data until 1989. Number of actual observations by date: 27.
Source name:
World Development Indicators
Source organization:
World Bank national accounts data, and OECD National Accounts data files.
Categories, topics:
Economy & Growth
Last updated:
apr 23, 2017
Indicators value changes by year
Minimum:
21.853 bln
jan 1, 1990
Maximum:
146.684 bln
jan 1, 2015
At the date of observation
Value
Absolute change
Change from previous value
jan 1, 1990
21.853 bln
+21.853 bln
0.0%
jan 1, 1991
26.562 bln
+4.709 bln
21.55%
jan 1, 1992
29.279 bln
+2.717 bln
10.23%
jan 1, 1993
32.459 bln
+3.18 bln
10.86%
jan 1, 1994
30.002 bln
-2.457 bln
-7.57%
jan 1, 1995
30.724 bln
+721.69 mln
2.41%
jan 1, 1996
35.735 bln
+5.011 bln
16.31%
jan 1, 1997
37.431 bln
+1.696 bln
4.75%
jan 1, 1998
37.973 bln
+542.692 mln
1.45%
jan 1, 1999
39.297 bln
+1.323 bln
3.48%
jan 1, 2000
40.685 bln
+1.389 bln
3.53%
jan 1, 2001
40.602 bln
-83.482 mln
-0.21%
jan 1, 2002
40.534 bln
-68.248 mln
-0.17%
jan 1, 2003
43.958 bln
+3.424 bln
8.45%
jan 1, 2004
54.348 bln
+10.39 bln
23.64%
jan 1, 2005
67.657 bln
+13.309 bln
24.49%
jan 1, 2006
74.908 bln
+7.251 bln
10.72%
jan 1, 2007
83.806 bln
+8.898 bln
11.88%
jan 1, 2008
101.089 bln
+17.282 bln
20.62%
jan 1, 2009
115.537 bln
+14.448 bln
14.29%
jan 1, 2010
109.391 bln
-6.146 bln
-5.32%
jan 1, 2011
114.575 bln
+5.184 bln
4.74%
jan 1, 2012
129.25 bln
+14.675 bln
12.81%
jan 1, 2013
131.534 bln
+2.284 bln
1.77%
jan 1, 2014
140.068 bln
+8.534 bln
6.49%
jan 1, 2015
146.684 bln
+6.616 bln
4.72%
jan 1, 2016
140.994 bln
-5.69 bln
-3.88%
Ranking of countries by current statistics by years


Comments: