29
/
en
AIzaSyAYiBZKx7MnpbEhh9jyipgxe19OcubqV5w
April 1, 2024
91252
Brazil
BRA
true
2
1
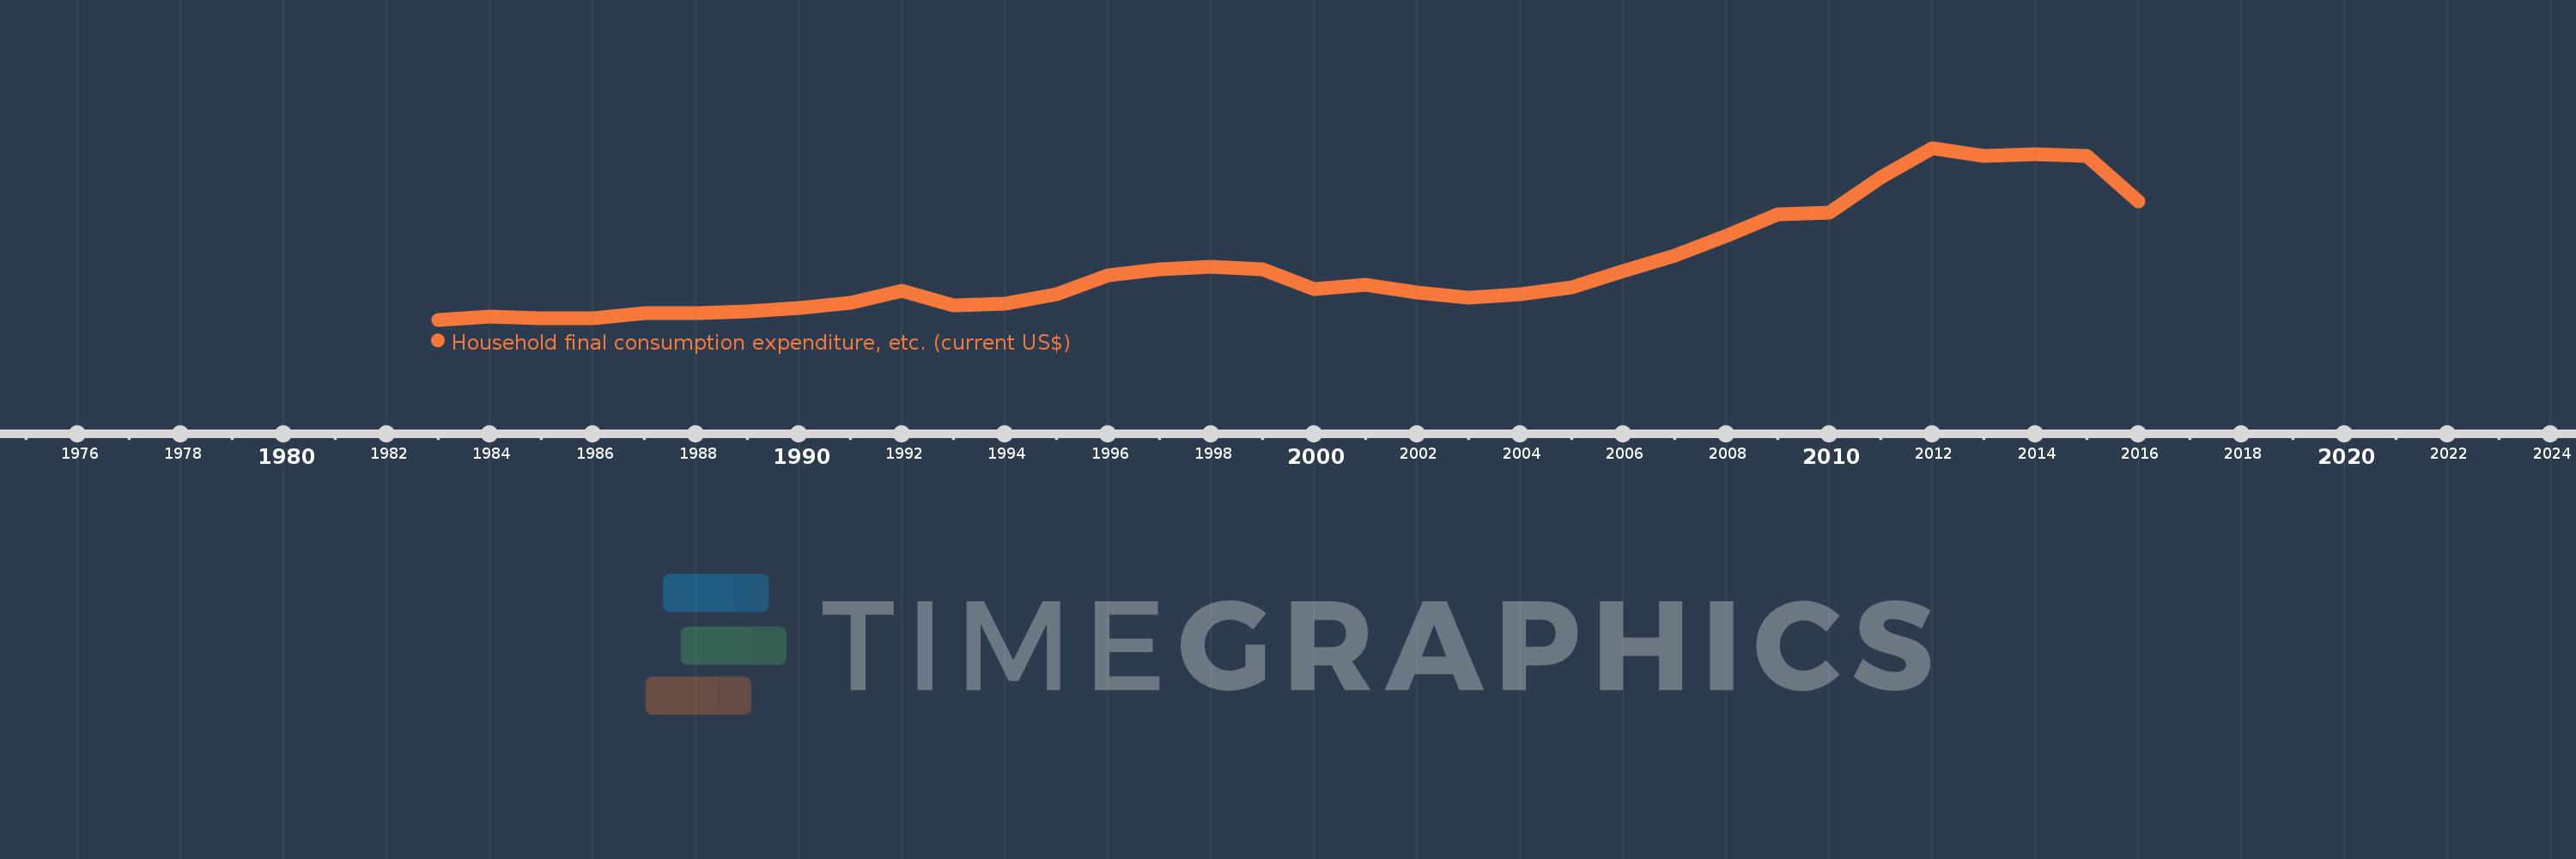
Household final consumption expenditure, etc. (current US$)
2016,2015,2014,2013,2012,2011,2010,2009,2008,2007,2006,2005,2004,2003,2002,2001,2000,1999,1998,1997,1996,1995,1994,1993,1992,1991,1990,1989,1988,1987,1986,1985,1984,1983
This statistics in other country:
AfghanistanAlbaniaAlgeriaAngolaAntigua and BarbudaArab WorldArgentinaArmeniaArubaAustraliaAustriaAzerbaijanBahamas, TheBahrainBangladeshBarbadosBelarusBelgiumBelizeBeninBermudaBhutanBoliviaBosnia and HerzegovinaBotswanaBrazilBrunei DarussalamBulgariaBurkina FasoBurundiCabo VerdeCambodiaCameroonCanadaCaribbean small statesCentral African RepublicCentral Europe and the BalticsChadChileChinaColombiaComorosCongo, Dem. Rep.Congo, Rep.Costa RicaCote d'IvoireCroatiaCubaCyprusCzech RepublicDenmarkDjiboutiDominicaDominican RepublicEarly-demographic dividendEast Asia & PacificEast Asia & Pacific (excluding high income)East Asia & Pacific (IDA & IBRD countries)EcuadorEgypt, Arab Rep.El SalvadorEquatorial GuineaEritreaEstoniaEthiopiaEuro areaEurope & Central AsiaEurope & Central Asia (excluding high income)Europe & Central Asia (IDA & IBRD countries)European UnionFaroe IslandsFijiFinlandFragile and conflict affected situationsFranceGabonGambia, TheGeorgiaGermanyGhanaGreeceGrenadaGuatemalaGuineaGuinea-BissauGuyanaHaitiHeavily indebted poor countries (HIPC)High incomeHondurasHong Kong SAR, ChinaHungaryIBRD onlyIcelandIDA & IBRD totalIDA blendIDA onlyIDA totalIndiaIndonesiaIran, Islamic Rep.IraqIrelandIsraelItalyJamaicaJapanJordanKazakhstanKenyaKiribatiKorea, Rep.KosovoKuwaitKyrgyz RepublicLao PDRLate-demographic dividendLatin America & Caribbean Latin America & Caribbean (excluding high income)Latin America & the Caribbean (IDA & IBRD countries)LatviaLeast developed countries: UN classificationLebanonLesothoLiberiaLibyaLithuaniaLow & middle incomeLow incomeLower middle incomeLuxembourgMacao SAR, ChinaMacedonia, FYRMadagascarMalawiMalaysiaMaldivesMaliMaltaMauritaniaMauritiusMexicoMicronesia, Fed. Sts.Middle East & North AfricaMiddle East & North Africa (excluding high income)Middle East & North Africa (IDA & IBRD countries)Middle incomeMoldovaMongoliaMontenegroMoroccoMozambiqueNamibiaNepalNetherlandsNew CaledoniaNew ZealandNicaraguaNigerNigeriaNorth AmericaNorwayOECD membersOmanOther small statesPakistanPanamaPapua New GuineaParaguayPeruPhilippinesPolandPortugalPost-demographic dividendPre-demographic dividendPuerto RicoQatarRomaniaRussian FederationRwandaSaudi ArabiaSenegalSerbiaSeychellesSierra LeoneSingaporeSlovak RepublicSloveniaSmall statesSolomon IslandsSouth AfricaSouth AsiaSouth Asia (IDA & IBRD)South SudanSpainSri LankaSt. Kitts and NevisSt. LuciaSt. Vincent and the GrenadinesSub-Saharan Africa Sub-Saharan Africa (excluding high income)Sub-Saharan Africa (IDA & IBRD countries)SudanSurinameSwazilandSwedenSwitzerlandSyrian Arab RepublicTajikistanTanzaniaThailandTimor-LesteTogoTongaTrinidad and TobagoTunisiaTurkeyTurkmenistanUgandaUkraineUnited Arab EmiratesUnited KingdomUnited StatesUpper middle incomeUruguayUzbekistanVanuatuVenezuela, RBVietnamWest Bank and GazaWorldYemen, Rep.ZambiaZimbabwe Timeline:
This timeline shows a graph from 1983 to 2016 of Brazil. No data until 1982. Number of actual observations by date: 34.
Source name:
World Development Indicators
Source organization:
World Bank national accounts data, and OECD National Accounts data files.
Categories, topics:
Economy & Growth
Last updated:
apr 23, 2017
Indicators value changes by year
Minimum:
127.851 bln
jan 1, 1983
Maximum:
1.576 trl
jan 1, 2012
At the date of observation
Value
Absolute change
Change from previous value
jan 1, 1983
127.851 bln
+127.851 bln
0.0%
jan 1, 1984
151.889 bln
+24.038 bln
18.8%
jan 1, 1985
141.102 bln
-10.787 bln
-7.1%
jan 1, 1986
143.777 bln
+2.675 bln
1.9%
jan 1, 1987
180.483 bln
+36.706 bln
25.53%
jan 1, 1988
182.662 bln
+2.179 bln
1.21%
jan 1, 1989
196.509 bln
+13.847 bln
7.58%
jan 1, 1990
230.374 bln
+33.865 bln
17.23%
jan 1, 1991
273.952 bln
+43.578 bln
18.92%
jan 1, 1992
371.17 bln
+97.218 bln
35.49%
jan 1, 1993
246.446 bln
-124.725 bln
-33.6%
jan 1, 1994
263.04 bln
+16.594 bln
6.73%
jan 1, 1995
341.439 bln
+78.399 bln
29.81%
jan 1, 1996
503.355 bln
+161.916 bln
47.42%
jan 1, 1997
554.115 bln
+50.76 bln
10.08%
jan 1, 1998
576.813 bln
+22.698 bln
4.1%
jan 1, 1999
554.012 bln
-22.801 bln
-3.95%
jan 1, 2000
387.686 bln
-166.326 bln
-30.02%
jan 1, 2001
423.354 bln
+35.668 bln
9.2%
jan 1, 2002
358.602 bln
-64.752 bln
-15.29%
jan 1, 2003
314.421 bln
-44.181 bln
-12.32%
jan 1, 2004
345.291 bln
+30.87 bln
9.82%
jan 1, 2005
402.972 bln
+57.681 bln
16.71%
jan 1, 2006
539.475 bln
+136.503 bln
33.87%
jan 1, 2007
669.431 bln
+129.956 bln
24.09%
jan 1, 2008
836.504 bln
+167.073 bln
24.96%
jan 1, 2009
1.013 trl
+176.426 bln
21.09%
jan 1, 2010
1.033 trl
+19.898 bln
1.96%
jan 1, 2011
1.33 trl
+297.418 bln
28.8%
jan 1, 2012
1.576 trl
+245.497 bln
18.46%
jan 1, 2013
1.51 trl
-65.496 bln
-4.16%
jan 1, 2014
1.519 trl
+9.188 bln
0.61%
jan 1, 2015
1.508 trl
-11.815 bln
-0.78%
jan 1, 2016
1.125 trl
-382.893 bln
-25.4%
Ranking of countries by current statistics by years


Comments: