29
/
en
AIzaSyAYiBZKx7MnpbEhh9jyipgxe19OcubqV5w
April 1, 2024
210475
Nicaragua
NIC
true
2
1
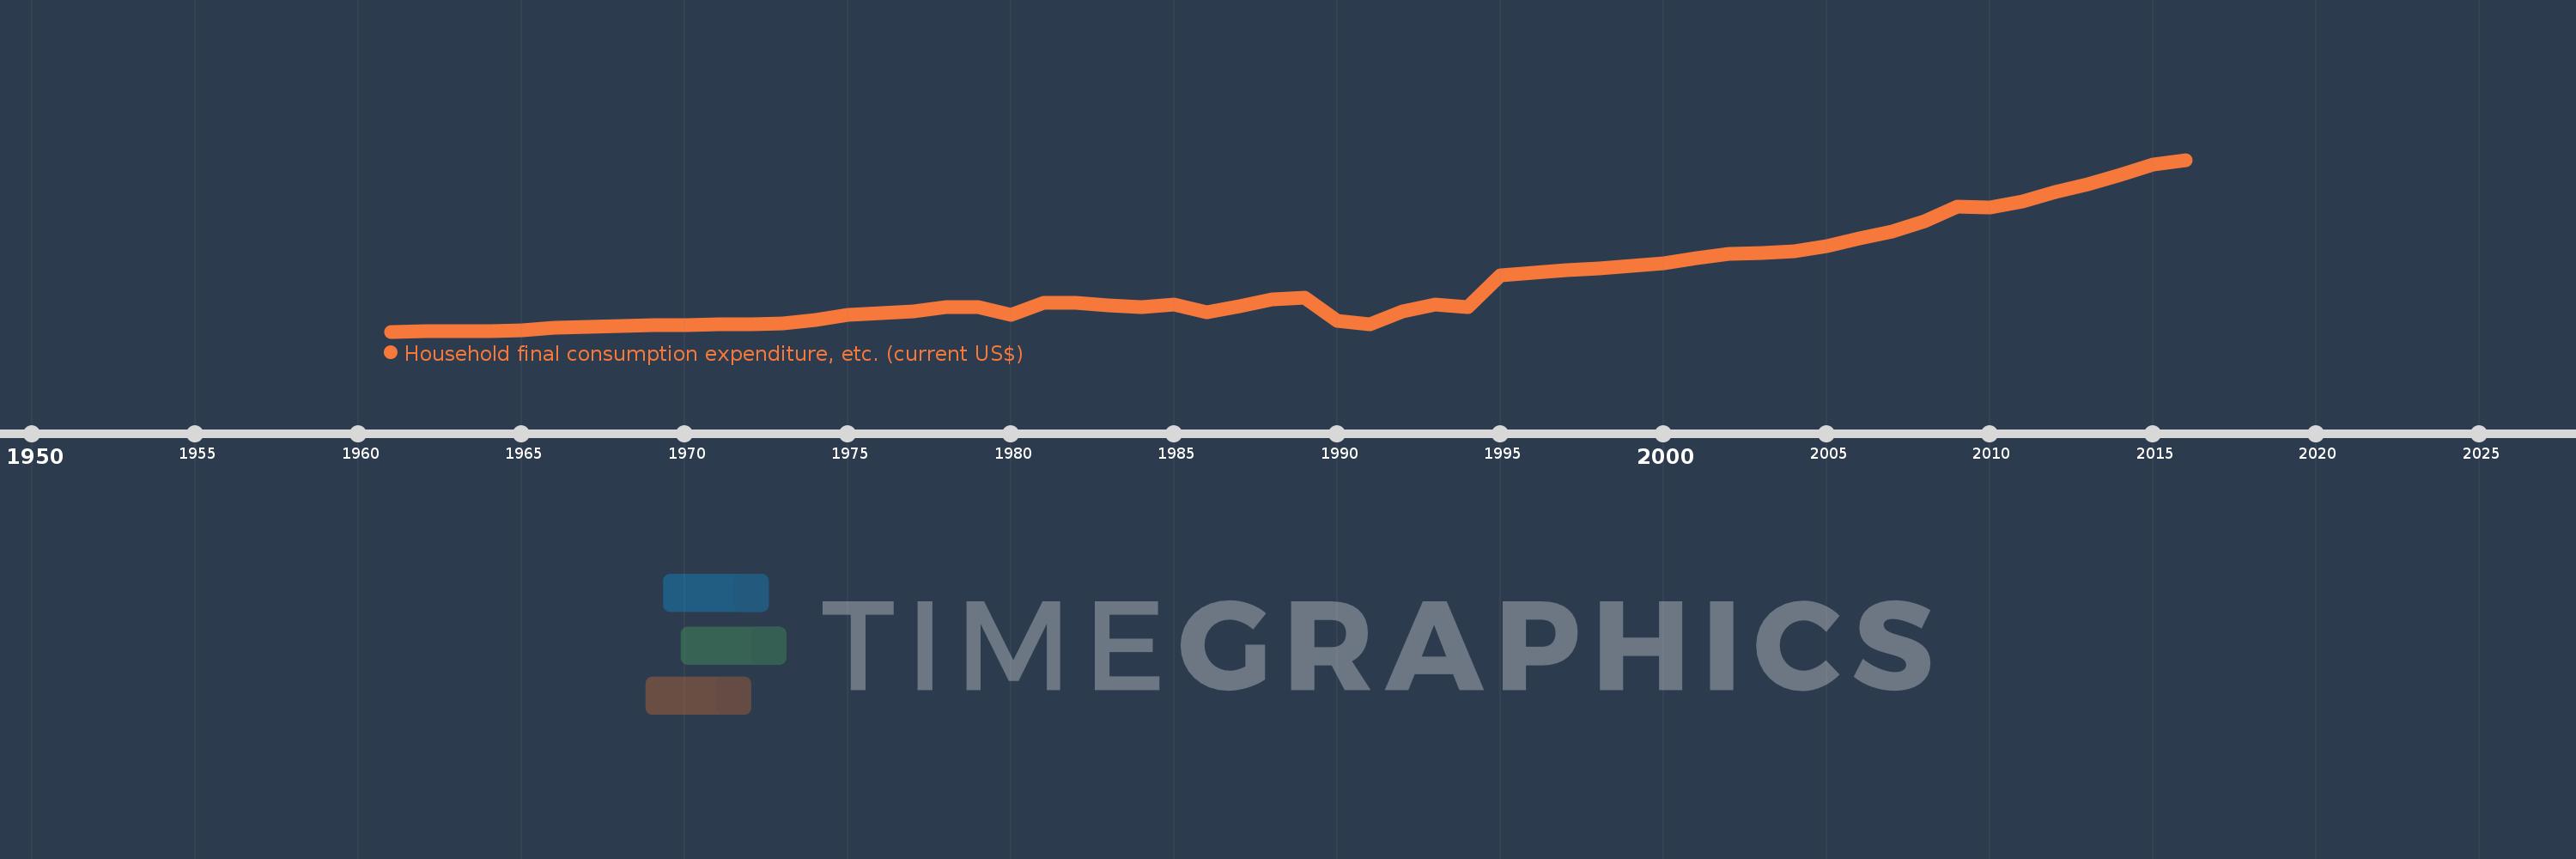
Household final consumption expenditure, etc. (current US$)
2016,2015,2014,2013,2012,2011,2010,2009,2008,2007,2006,2005,2004,2003,2002,2001,2000,1999,1998,1997,1996,1995,1994,1993,1992,1991,1990,1989,1988,1987,1986,1985,1984,1983,1982,1981,1980,1979,1978,1977,1976,1975,1974,1973,1972,1971,1970,1969,1968,1967,1966,1965,1964,1963,1962,1961
This statistics in other country:
AfghanistanAlbaniaAlgeriaAngolaAntigua and BarbudaArab WorldArgentinaArmeniaArubaAustraliaAustriaAzerbaijanBahamas, TheBahrainBangladeshBarbadosBelarusBelgiumBelizeBeninBermudaBhutanBoliviaBosnia and HerzegovinaBotswanaBrazilBrunei DarussalamBulgariaBurkina FasoBurundiCabo VerdeCambodiaCameroonCanadaCaribbean small statesCentral African RepublicCentral Europe and the BalticsChadChileChinaColombiaComorosCongo, Dem. Rep.Congo, Rep.Costa RicaCote d'IvoireCroatiaCubaCyprusCzech RepublicDenmarkDjiboutiDominicaDominican RepublicEarly-demographic dividendEast Asia & PacificEast Asia & Pacific (excluding high income)East Asia & Pacific (IDA & IBRD countries)EcuadorEgypt, Arab Rep.El SalvadorEquatorial GuineaEritreaEstoniaEthiopiaEuro areaEurope & Central AsiaEurope & Central Asia (excluding high income)Europe & Central Asia (IDA & IBRD countries)European UnionFaroe IslandsFijiFinlandFragile and conflict affected situationsFranceGabonGambia, TheGeorgiaGermanyGhanaGreeceGrenadaGuatemalaGuineaGuinea-BissauGuyanaHaitiHeavily indebted poor countries (HIPC)High incomeHondurasHong Kong SAR, ChinaHungaryIBRD onlyIcelandIDA & IBRD totalIDA blendIDA onlyIDA totalIndiaIndonesiaIran, Islamic Rep.IraqIrelandIsraelItalyJamaicaJapanJordanKazakhstanKenyaKiribatiKorea, Rep.KosovoKuwaitKyrgyz RepublicLao PDRLate-demographic dividendLatin America & Caribbean Latin America & Caribbean (excluding high income)Latin America & the Caribbean (IDA & IBRD countries)LatviaLeast developed countries: UN classificationLebanonLesothoLiberiaLibyaLithuaniaLow & middle incomeLow incomeLower middle incomeLuxembourgMacao SAR, ChinaMacedonia, FYRMadagascarMalawiMalaysiaMaldivesMaliMaltaMauritaniaMauritiusMexicoMicronesia, Fed. Sts.Middle East & North AfricaMiddle East & North Africa (excluding high income)Middle East & North Africa (IDA & IBRD countries)Middle incomeMoldovaMongoliaMontenegroMoroccoMozambiqueNamibiaNepalNetherlandsNew CaledoniaNew ZealandNicaraguaNigerNigeriaNorth AmericaNorwayOECD membersOmanOther small statesPakistanPanamaPapua New GuineaParaguayPeruPhilippinesPolandPortugalPost-demographic dividendPre-demographic dividendPuerto RicoQatarRomaniaRussian FederationRwandaSaudi ArabiaSenegalSerbiaSeychellesSierra LeoneSingaporeSlovak RepublicSloveniaSmall statesSolomon IslandsSouth AfricaSouth AsiaSouth Asia (IDA & IBRD)South SudanSpainSri LankaSt. Kitts and NevisSt. LuciaSt. Vincent and the GrenadinesSub-Saharan Africa Sub-Saharan Africa (excluding high income)Sub-Saharan Africa (IDA & IBRD countries)SudanSurinameSwazilandSwedenSwitzerlandSyrian Arab RepublicTajikistanTanzaniaThailandTimor-LesteTogoTongaTrinidad and TobagoTunisiaTurkeyTurkmenistanUgandaUkraineUnited Arab EmiratesUnited KingdomUnited StatesUpper middle incomeUruguayUzbekistanVanuatuVenezuela, RBVietnamWest Bank and GazaWorldYemen, Rep.ZambiaZimbabwe Timeline:
This timeline shows a graph from 1961 to 2016 of Nicaragua. No data until 1960. Number of actual observations by date: 56.
Source name:
World Development Indicators
Source organization:
World Bank national accounts data, and OECD National Accounts data files.
Categories, topics:
Economy & Growth
Last updated:
apr 23, 2017
Indicators value changes by year
Minimum:
176.547 mln
jan 1, 1961
Maximum:
10.012 bln
jan 1, 2016
At the date of observation
Value
Absolute change
Change from previous value
jan 1, 1961
176.547 mln
+176.547 mln
0.0%
jan 1, 1962
187.017 mln
+10.47 mln
5.93%
jan 1, 1963
204.141 mln
+17.124 mln
9.16%
jan 1, 1964
224.605 mln
+20.464 mln
10.02%
jan 1, 1965
256.015 mln
+31.41 mln
13.98%
jan 1, 1966
420.4 mln
+164.385 mln
64.21%
jan 1, 1967
457.243 mln
+36.843 mln
8.76%
jan 1, 1968
514.329 mln
+57.086 mln
12.48%
jan 1, 1969
535.557 mln
+21.229 mln
4.13%
jan 1, 1970
561.657 mln
+26.1 mln
4.87%
jan 1, 1971
576.8 mln
+15.143 mln
2.7%
jan 1, 1972
618.229 mln
+41.429 mln
7.18%
jan 1, 1973
635.186 mln
+16.957 mln
2.74%
jan 1, 1974
847.243 mln
+212.057 mln
33.39%
jan 1, 1975
1.13 bln
+283.071 mln
33.41%
jan 1, 1976
1.247 bln
+117.057 mln
10.36%
jan 1, 1977
1.334 bln
+86.571 mln
6.94%
jan 1, 1978
1.586 bln
+251.971 mln
18.89%
jan 1, 1979
1.558 bln
-27.586 mln
-1.74%
jan 1, 1980
1.131 bln
-427.76 mln
-27.45%
jan 1, 1981
1.807 bln
+676.368 mln
59.83%
jan 1, 1982
1.809 bln
+2.463 mln
0.14%
jan 1, 1983
1.673 bln
-136.644 mln
-7.55%
jan 1, 1984
1.555 bln
-118.198 mln
-7.07%
jan 1, 1985
1.722 bln
+167.159 mln
10.75%
jan 1, 1986
1.293 bln
-428.366 mln
-24.88%
jan 1, 1987
1.611 bln
+317.205 mln
24.53%
jan 1, 1988
2.001 bln
+390.454 mln
24.24%
jan 1, 1989
2.14 bln
+138.7 mln
6.93%
jan 1, 1990
795.31 mln
-1.344 bln
-62.83%
jan 1, 1991
591.935 mln
-203.374 mln
-25.57%
jan 1, 1992
1.33 bln
+738.415 mln
124.75%
jan 1, 1993
1.711 bln
+380.309 mln
28.59%
jan 1, 1994
1.587 bln
-123.258 mln
-7.21%
jan 1, 1995
3.391 bln
+1.804 bln
113.62%
jan 1, 1996
3.536 bln
+145.053 mln
4.28%
jan 1, 1997
3.674 bln
+137.444 mln
3.89%
jan 1, 1998
3.774 bln
+100.29 mln
2.73%
jan 1, 1999
3.958 bln
+184.385 mln
4.89%
jan 1, 2000
4.091 bln
+132.532 mln
3.35%
jan 1, 2001
4.38 bln
+288.793 mln
7.06%
jan 1, 2002
4.611 bln
+231.701 mln
5.29%
jan 1, 2003
4.661 bln
+49.755 mln
1.08%
jan 1, 2004
4.755 bln
+93.516 mln
2.01%
jan 1, 2005
5.093 bln
+338.631 mln
7.12%
jan 1, 2006
5.535 bln
+442.301 mln
8.68%
jan 1, 2007
5.9 bln
+364.327 mln
6.58%
jan 1, 2008
6.499 bln
+599.661 mln
10.16%
jan 1, 2009
7.338 bln
+838.771 mln
12.91%
jan 1, 2010
7.261 bln
-77.418 mln
-1.05%
jan 1, 2011
7.614 bln
+353.591 mln
4.87%
jan 1, 2012
8.143 bln
+529.091 mln
6.95%
jan 1, 2013
8.606 bln
+462.023 mln
5.67%
jan 1, 2014
9.15 bln
+544.125 mln
6.32%
jan 1, 2015
9.76 bln
+610.103 mln
6.67%
jan 1, 2016
10.012 bln
+252.403 mln
2.59%
Ranking of countries by current statistics by years


Comments: