29
/
en
AIzaSyAYiBZKx7MnpbEhh9jyipgxe19OcubqV5w
April 1, 2024
254227
Suriname
SUR
true
2
1
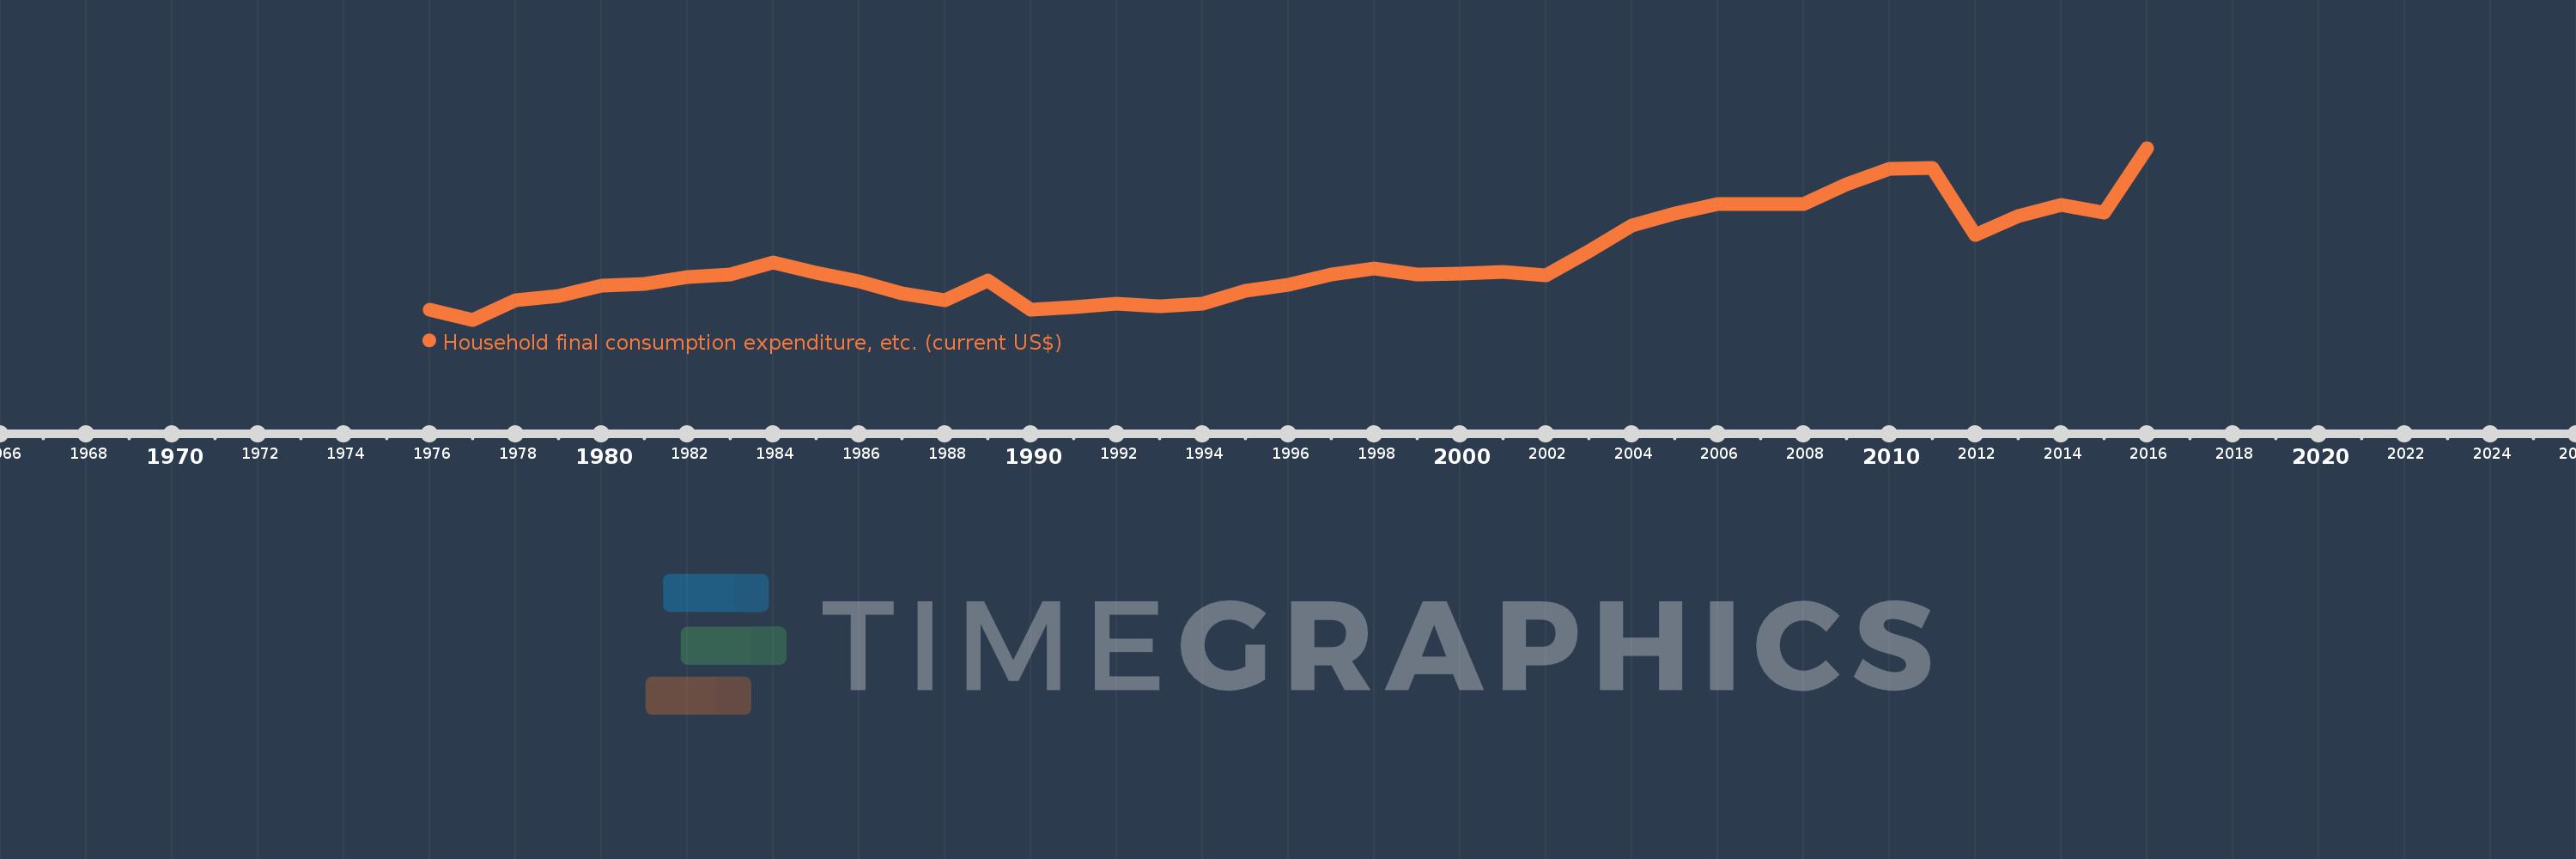
Household final consumption expenditure, etc. (current US$)
2016,2015,2014,2013,2012,2011,2010,2009,2008,2007,2006,2005,2004,2003,2002,2001,2000,1999,1998,1997,1996,1995,1994,1993,1992,1991,1990,1989,1988,1987,1986,1985,1984,1983,1982,1981,1980,1979,1978,1977,1976
This statistics in other country:
AfghanistanAlbaniaAlgeriaAngolaAntigua and BarbudaArab WorldArgentinaArmeniaArubaAustraliaAustriaAzerbaijanBahamas, TheBahrainBangladeshBarbadosBelarusBelgiumBelizeBeninBermudaBhutanBoliviaBosnia and HerzegovinaBotswanaBrazilBrunei DarussalamBulgariaBurkina FasoBurundiCabo VerdeCambodiaCameroonCanadaCaribbean small statesCentral African RepublicCentral Europe and the BalticsChadChileChinaColombiaComorosCongo, Dem. Rep.Congo, Rep.Costa RicaCote d'IvoireCroatiaCubaCyprusCzech RepublicDenmarkDjiboutiDominicaDominican RepublicEarly-demographic dividendEast Asia & PacificEast Asia & Pacific (excluding high income)East Asia & Pacific (IDA & IBRD countries)EcuadorEgypt, Arab Rep.El SalvadorEquatorial GuineaEritreaEstoniaEthiopiaEuro areaEurope & Central AsiaEurope & Central Asia (excluding high income)Europe & Central Asia (IDA & IBRD countries)European UnionFaroe IslandsFijiFinlandFragile and conflict affected situationsFranceGabonGambia, TheGeorgiaGermanyGhanaGreeceGrenadaGuatemalaGuineaGuinea-BissauGuyanaHaitiHeavily indebted poor countries (HIPC)High incomeHondurasHong Kong SAR, ChinaHungaryIBRD onlyIcelandIDA & IBRD totalIDA blendIDA onlyIDA totalIndiaIndonesiaIran, Islamic Rep.IraqIrelandIsraelItalyJamaicaJapanJordanKazakhstanKenyaKiribatiKorea, Rep.KosovoKuwaitKyrgyz RepublicLao PDRLate-demographic dividendLatin America & Caribbean Latin America & Caribbean (excluding high income)Latin America & the Caribbean (IDA & IBRD countries)LatviaLeast developed countries: UN classificationLebanonLesothoLiberiaLibyaLithuaniaLow & middle incomeLow incomeLower middle incomeLuxembourgMacao SAR, ChinaMacedonia, FYRMadagascarMalawiMalaysiaMaldivesMaliMaltaMauritaniaMauritiusMexicoMicronesia, Fed. Sts.Middle East & North AfricaMiddle East & North Africa (excluding high income)Middle East & North Africa (IDA & IBRD countries)Middle incomeMoldovaMongoliaMontenegroMoroccoMozambiqueNamibiaNepalNetherlandsNew CaledoniaNew ZealandNicaraguaNigerNigeriaNorth AmericaNorwayOECD membersOmanOther small statesPakistanPanamaPapua New GuineaParaguayPeruPhilippinesPolandPortugalPost-demographic dividendPre-demographic dividendPuerto RicoQatarRomaniaRussian FederationRwandaSaudi ArabiaSenegalSerbiaSeychellesSierra LeoneSingaporeSlovak RepublicSloveniaSmall statesSolomon IslandsSouth AfricaSouth AsiaSouth Asia (IDA & IBRD)South SudanSpainSri LankaSt. Kitts and NevisSt. LuciaSt. Vincent and the GrenadinesSub-Saharan Africa Sub-Saharan Africa (excluding high income)Sub-Saharan Africa (IDA & IBRD countries)SudanSurinameSwazilandSwedenSwitzerlandSyrian Arab RepublicTajikistanTanzaniaThailandTimor-LesteTogoTongaTrinidad and TobagoTunisiaTurkeyTurkmenistanUgandaUkraineUnited Arab EmiratesUnited KingdomUnited StatesUpper middle incomeUruguayUzbekistanVanuatuVenezuela, RBVietnamWest Bank and GazaWorldYemen, Rep.ZambiaZimbabwe Timeline:
This timeline shows a graph from 1976 to 2016 of Suriname. No data until 1975. Number of actual observations by date: 41.
Source name:
World Development Indicators
Source organization:
World Bank national accounts data, and OECD National Accounts data files.
Categories, topics:
Economy & Growth
Last updated:
apr 23, 2017
Indicators value changes by year
Minimum:
121.5 mln
jan 1, 1977
Maximum:
1.718 bln
jan 1, 2016
At the date of observation
Value
Absolute change
Change from previous value
jan 1, 1976
211.5 mln
+211.5 mln
0.0%
jan 1, 1977
121.5 mln
-90.0 mln
-42.55%
jan 1, 1978
304.5 mln
+183.0 mln
150.62%
jan 1, 1979
346.5 mln
+42.0 mln
13.79%
jan 1, 1980
435.0 mln
+88.5 mln
25.54%
jan 1, 1981
458.4 mln
+23.4 mln
5.38%
jan 1, 1982
520.05 mln
+61.65 mln
13.45%
jan 1, 1983
542.65 mln
+22.6 mln
4.35%
jan 1, 1984
656.9 mln
+114.25 mln
21.05%
jan 1, 1985
559.7 mln
-97.2 mln
-14.8%
jan 1, 1986
480.5 mln
-79.2 mln
-14.15%
jan 1, 1987
368.45 mln
-112.05 mln
-23.32%
jan 1, 1988
303.8 mln
-64.65 mln
-17.55%
jan 1, 1989
485.9 mln
+182.1 mln
59.94%
jan 1, 1990
212.96 mln
-272.94 mln
-56.17%
jan 1, 1991
239.26 mln
+26.3 mln
12.35%
jan 1, 1992
274.66 mln
+35.4 mln
14.8%
jan 1, 1993
245.813 mln
-28.847 mln
-10.5%
jan 1, 1994
274.785 mln
+28.972 mln
11.79%
jan 1, 1995
388.273 mln
+113.488 mln
41.3%
jan 1, 1996
442.704 mln
+54.431 mln
14.02%
jan 1, 1997
540.876 mln
+98.171 mln
22.18%
jan 1, 1998
598.523 mln
+57.647 mln
10.66%
jan 1, 1999
539.109 mln
-59.414 mln
-9.93%
jan 1, 2000
547.198 mln
+8.089 mln
1.5%
jan 1, 2001
567.568 mln
+20.37 mln
3.72%
jan 1, 2002
535.003 mln
-32.565 mln
-5.74%
jan 1, 2003
754.675 mln
+219.671 mln
41.06%
jan 1, 2004
996.072 mln
+241.397 mln
31.99%
jan 1, 2005
1.106 bln
+110.179 mln
11.06%
jan 1, 2006
1.194 bln
+87.263 mln
7.89%
jan 1, 2007
1.198 bln
+4.73 mln
0.4%
jan 1, 2008
1.195 bln
-2.981 mln
-0.25%
jan 1, 2009
1.377 bln
+182.149 mln
15.24%
jan 1, 2010
1.527 bln
+149.727 mln
10.87%
jan 1, 2011
1.529 bln
+1.963 mln
0.13%
jan 1, 2012
913.433 mln
-615.67 mln
-40.26%
jan 1, 2013
1.082 bln
+168.688 mln
18.47%
jan 1, 2014
1.188 bln
+105.758 mln
9.77%
jan 1, 2015
1.116 bln
-71.818 mln
-6.05%
jan 1, 2016
1.718 bln
+602.264 mln
53.96%
Ranking of countries by current statistics by years


Comments: