29
/
en
AIzaSyAYiBZKx7MnpbEhh9jyipgxe19OcubqV5w
April 1, 2024
136831
Gambia, The
GMB
true
2
1
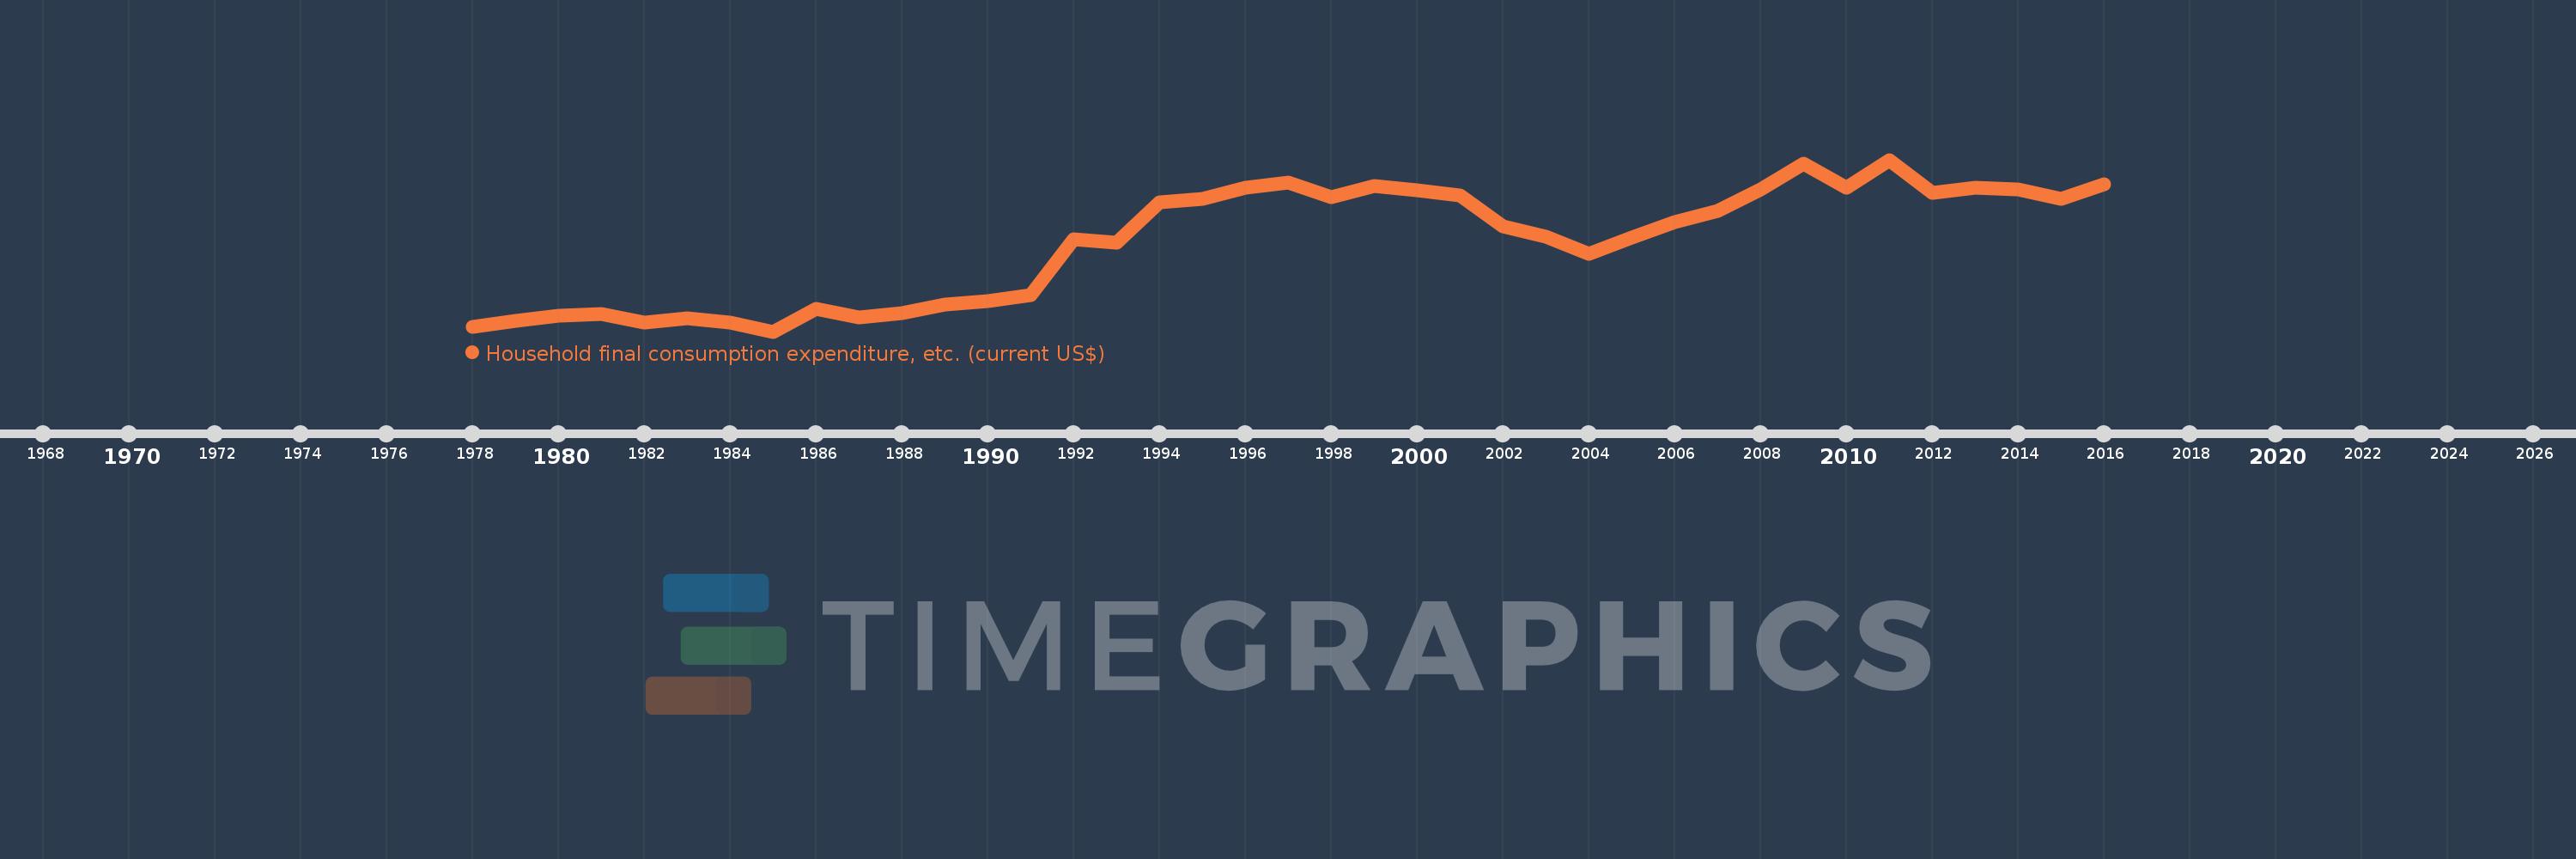
Household final consumption expenditure, etc. (current US$)
2016,2015,2014,2013,2012,2011,2010,2009,2008,2007,2006,2005,2004,2003,2002,2001,2000,1999,1998,1997,1996,1995,1994,1993,1992,1991,1990,1989,1988,1987,1986,1985,1984,1983,1982,1981,1980,1979,1978
This statistics in other country:
AfghanistanAlbaniaAlgeriaAngolaAntigua and BarbudaArab WorldArgentinaArmeniaArubaAustraliaAustriaAzerbaijanBahamas, TheBahrainBangladeshBarbadosBelarusBelgiumBelizeBeninBermudaBhutanBoliviaBosnia and HerzegovinaBotswanaBrazilBrunei DarussalamBulgariaBurkina FasoBurundiCabo VerdeCambodiaCameroonCanadaCaribbean small statesCentral African RepublicCentral Europe and the BalticsChadChileChinaColombiaComorosCongo, Dem. Rep.Congo, Rep.Costa RicaCote d'IvoireCroatiaCubaCyprusCzech RepublicDenmarkDjiboutiDominicaDominican RepublicEarly-demographic dividendEast Asia & PacificEast Asia & Pacific (excluding high income)East Asia & Pacific (IDA & IBRD countries)EcuadorEgypt, Arab Rep.El SalvadorEquatorial GuineaEritreaEstoniaEthiopiaEuro areaEurope & Central AsiaEurope & Central Asia (excluding high income)Europe & Central Asia (IDA & IBRD countries)European UnionFaroe IslandsFijiFinlandFragile and conflict affected situationsFranceGabonGambia, TheGeorgiaGermanyGhanaGreeceGrenadaGuatemalaGuineaGuinea-BissauGuyanaHaitiHeavily indebted poor countries (HIPC)High incomeHondurasHong Kong SAR, ChinaHungaryIBRD onlyIcelandIDA & IBRD totalIDA blendIDA onlyIDA totalIndiaIndonesiaIran, Islamic Rep.IraqIrelandIsraelItalyJamaicaJapanJordanKazakhstanKenyaKiribatiKorea, Rep.KosovoKuwaitKyrgyz RepublicLao PDRLate-demographic dividendLatin America & Caribbean Latin America & Caribbean (excluding high income)Latin America & the Caribbean (IDA & IBRD countries)LatviaLeast developed countries: UN classificationLebanonLesothoLiberiaLibyaLithuaniaLow & middle incomeLow incomeLower middle incomeLuxembourgMacao SAR, ChinaMacedonia, FYRMadagascarMalawiMalaysiaMaldivesMaliMaltaMauritaniaMauritiusMexicoMicronesia, Fed. Sts.Middle East & North AfricaMiddle East & North Africa (excluding high income)Middle East & North Africa (IDA & IBRD countries)Middle incomeMoldovaMongoliaMontenegroMoroccoMozambiqueNamibiaNepalNetherlandsNew CaledoniaNew ZealandNicaraguaNigerNigeriaNorth AmericaNorwayOECD membersOmanOther small statesPakistanPanamaPapua New GuineaParaguayPeruPhilippinesPolandPortugalPost-demographic dividendPre-demographic dividendPuerto RicoQatarRomaniaRussian FederationRwandaSaudi ArabiaSenegalSerbiaSeychellesSierra LeoneSingaporeSlovak RepublicSloveniaSmall statesSolomon IslandsSouth AfricaSouth AsiaSouth Asia (IDA & IBRD)South SudanSpainSri LankaSt. Kitts and NevisSt. LuciaSt. Vincent and the GrenadinesSub-Saharan Africa Sub-Saharan Africa (excluding high income)Sub-Saharan Africa (IDA & IBRD countries)SudanSurinameSwazilandSwedenSwitzerlandSyrian Arab RepublicTajikistanTanzaniaThailandTimor-LesteTogoTongaTrinidad and TobagoTunisiaTurkeyTurkmenistanUgandaUkraineUnited Arab EmiratesUnited KingdomUnited StatesUpper middle incomeUruguayUzbekistanVanuatuVenezuela, RBVietnamWest Bank and GazaWorldYemen, Rep.ZambiaZimbabwe Timeline:
This timeline shows a graph from 1978 to 2016 of Gambia, The. No data until 1977. Number of actual observations by date: 39.
Source name:
World Development Indicators
Source organization:
World Bank national accounts data, and OECD National Accounts data files.
Categories, topics:
Economy & Growth
Last updated:
apr 23, 2017
Indicators value changes by year
Minimum:
72.417 mln
jan 1, 1985
Maximum:
862.078 mln
jan 1, 2011
At the date of observation
Value
Absolute change
Change from previous value
jan 1, 1978
94.262 mln
+94.262 mln
0.0%
jan 1, 1979
122.701 mln
+28.438 mln
30.17%
jan 1, 1980
145.207 mln
+22.507 mln
18.34%
jan 1, 1981
151.771 mln
+6.564 mln
4.52%
jan 1, 1982
112.67 mln
-39.101 mln
-25.76%
jan 1, 1983
131.666 mln
+18.997 mln
16.86%
jan 1, 1984
114.72 mln
-16.946 mln
-12.87%
jan 1, 1985
72.417 mln
-42.303 mln
-36.87%
jan 1, 1986
178.394 mln
+105.977 mln
146.34%
jan 1, 1987
138.173 mln
-40.221 mln
-22.55%
jan 1, 1988
156.725 mln
+18.551 mln
13.43%
jan 1, 1989
197.101 mln
+40.376 mln
25.76%
jan 1, 1990
214.318 mln
+17.217 mln
8.73%
jan 1, 1991
239.681 mln
+25.364 mln
11.83%
jan 1, 1992
495.685 mln
+256.004 mln
106.81%
jan 1, 1993
480.73 mln
-14.955 mln
-3.02%
jan 1, 1994
667.68 mln
+186.95 mln
38.89%
jan 1, 1995
682.286 mln
+14.606 mln
2.19%
jan 1, 1996
732.988 mln
+50.702 mln
7.43%
jan 1, 1997
756.133 mln
+23.146 mln
3.16%
jan 1, 1998
691.224 mln
-64.909 mln
-8.58%
jan 1, 1999
742.686 mln
+51.462 mln
7.45%
jan 1, 2000
721.238 mln
-21.448 mln
-2.89%
jan 1, 2001
696.582 mln
-24.657 mln
-3.42%
jan 1, 2002
555.069 mln
-141.512 mln
-20.32%
jan 1, 2003
509.582 mln
-45.488 mln
-8.19%
jan 1, 2004
427.997 mln
-81.585 mln
-16.01%
jan 1, 2005
505.224 mln
+77.227 mln
18.04%
jan 1, 2006
576.02 mln
+70.796 mln
14.01%
jan 1, 2007
625.265 mln
+49.246 mln
8.55%
jan 1, 2008
724.417 mln
+99.152 mln
15.86%
jan 1, 2009
842.843 mln
+118.425 mln
16.35%
jan 1, 2010
734.7 mln
-108.143 mln
-12.83%
jan 1, 2011
862.078 mln
+127.379 mln
17.34%
jan 1, 2012
709.91 mln
-152.168 mln
-17.65%
jan 1, 2013
734.004 mln
+24.094 mln
3.39%
jan 1, 2014
724.865 mln
-9.139 mln
-1.25%
jan 1, 2015
681.535 mln
-43.33 mln
-5.98%
jan 1, 2016
749.191 mln
+67.656 mln
9.93%
Ranking of countries by current statistics by years


Comments: