29
/
en
AIzaSyAYiBZKx7MnpbEhh9jyipgxe19OcubqV5w
April 1, 2024
157391
Iran, Islamic Rep.
IRN
true
2
1
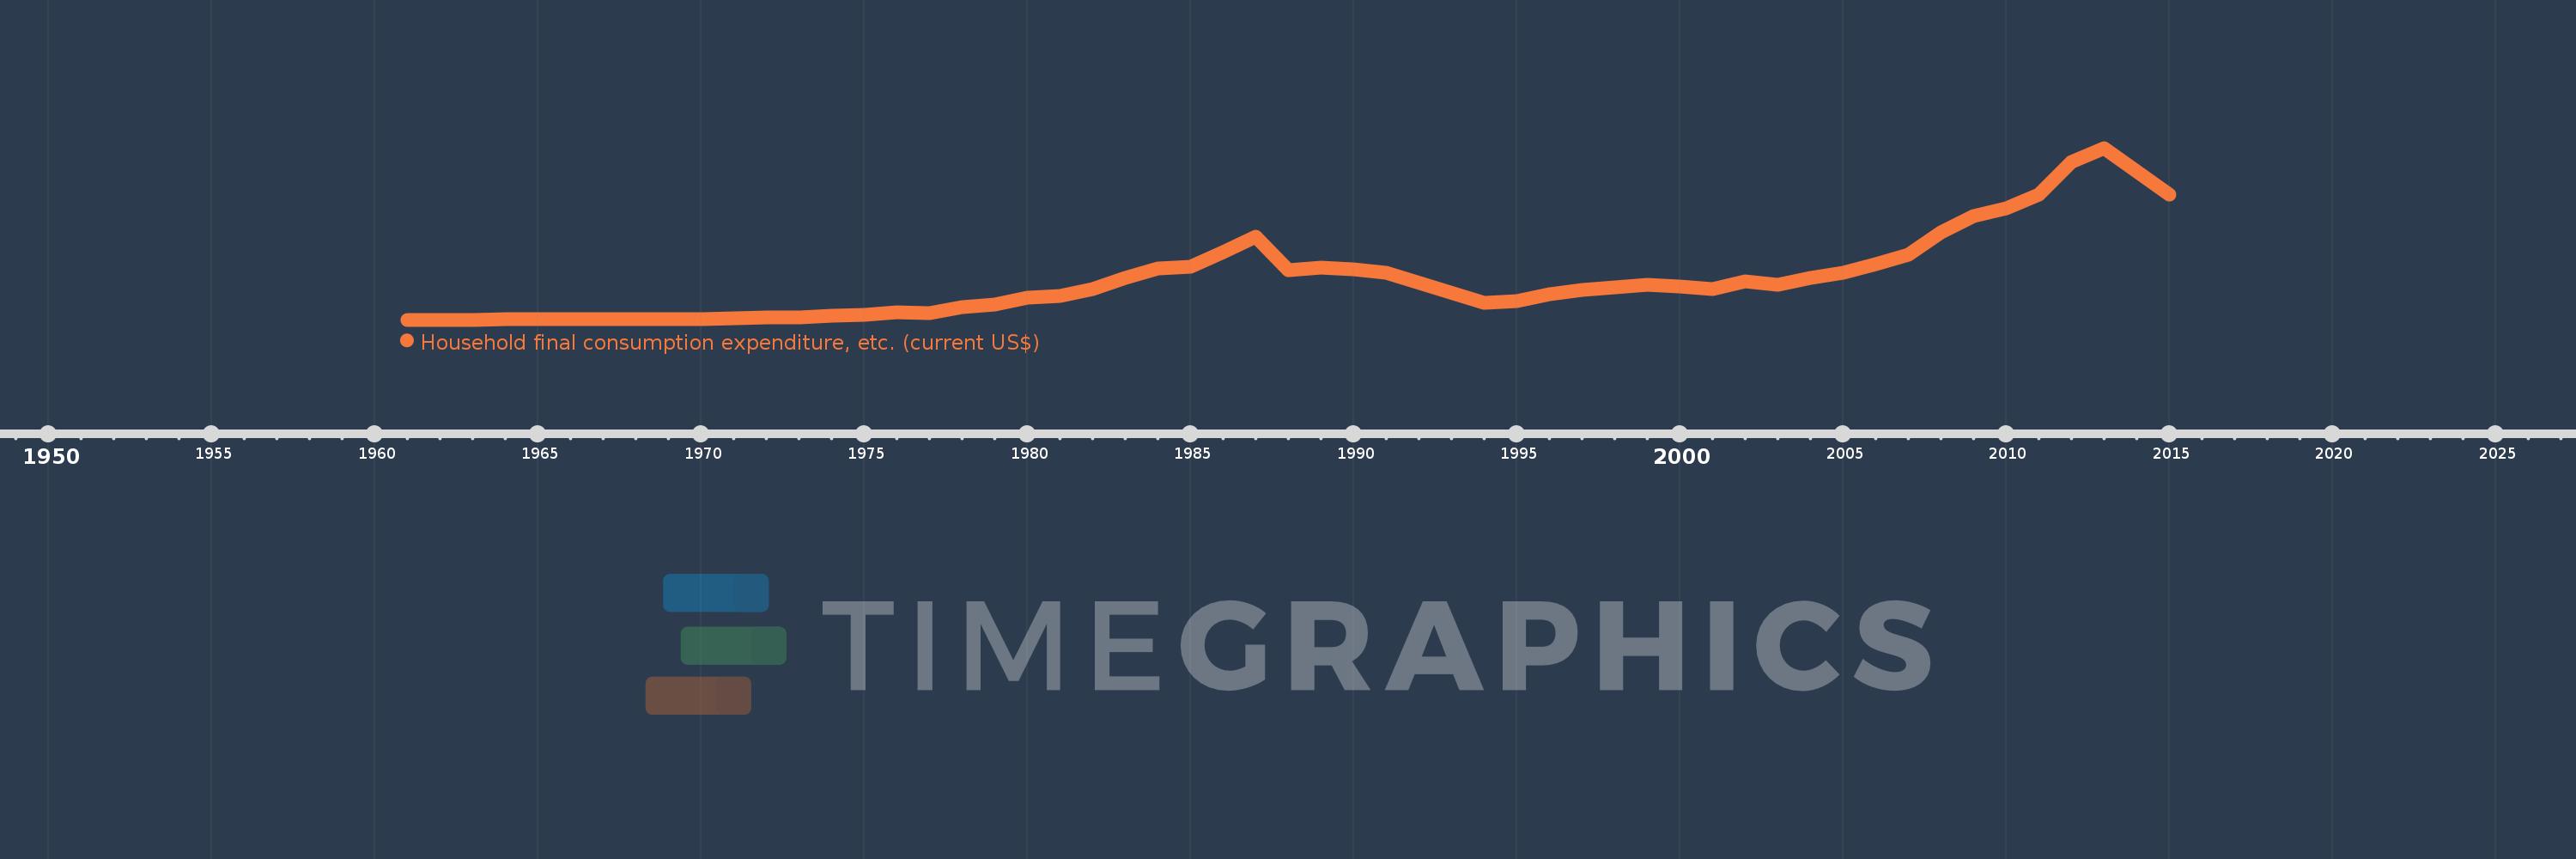
Household final consumption expenditure, etc. (current US$)
2015,2014,2013,2012,2011,2010,2009,2008,2007,2006,2005,2004,2003,2002,2001,2000,1999,1998,1997,1996,1995,1994,1991,1990,1989,1988,1987,1986,1985,1984,1983,1982,1981,1980,1979,1978,1977,1976,1975,1974,1973,1972,1971,1970,1969,1968,1967,1966,1965,1964,1963,1962,1961
This statistics in other country:
AfghanistanAlbaniaAlgeriaAngolaAntigua and BarbudaArab WorldArgentinaArmeniaArubaAustraliaAustriaAzerbaijanBahamas, TheBahrainBangladeshBarbadosBelarusBelgiumBelizeBeninBermudaBhutanBoliviaBosnia and HerzegovinaBotswanaBrazilBrunei DarussalamBulgariaBurkina FasoBurundiCabo VerdeCambodiaCameroonCanadaCaribbean small statesCentral African RepublicCentral Europe and the BalticsChadChileChinaColombiaComorosCongo, Dem. Rep.Congo, Rep.Costa RicaCote d'IvoireCroatiaCubaCyprusCzech RepublicDenmarkDjiboutiDominicaDominican RepublicEarly-demographic dividendEast Asia & PacificEast Asia & Pacific (excluding high income)East Asia & Pacific (IDA & IBRD countries)EcuadorEgypt, Arab Rep.El SalvadorEquatorial GuineaEritreaEstoniaEthiopiaEuro areaEurope & Central AsiaEurope & Central Asia (excluding high income)Europe & Central Asia (IDA & IBRD countries)European UnionFaroe IslandsFijiFinlandFragile and conflict affected situationsFranceGabonGambia, TheGeorgiaGermanyGhanaGreeceGrenadaGuatemalaGuineaGuinea-BissauGuyanaHaitiHeavily indebted poor countries (HIPC)High incomeHondurasHong Kong SAR, ChinaHungaryIBRD onlyIcelandIDA & IBRD totalIDA blendIDA onlyIDA totalIndiaIndonesiaIran, Islamic Rep.IraqIrelandIsraelItalyJamaicaJapanJordanKazakhstanKenyaKiribatiKorea, Rep.KosovoKuwaitKyrgyz RepublicLao PDRLate-demographic dividendLatin America & Caribbean Latin America & Caribbean (excluding high income)Latin America & the Caribbean (IDA & IBRD countries)LatviaLeast developed countries: UN classificationLebanonLesothoLiberiaLibyaLithuaniaLow & middle incomeLow incomeLower middle incomeLuxembourgMacao SAR, ChinaMacedonia, FYRMadagascarMalawiMalaysiaMaldivesMaliMaltaMauritaniaMauritiusMexicoMicronesia, Fed. Sts.Middle East & North AfricaMiddle East & North Africa (excluding high income)Middle East & North Africa (IDA & IBRD countries)Middle incomeMoldovaMongoliaMontenegroMoroccoMozambiqueNamibiaNepalNetherlandsNew CaledoniaNew ZealandNicaraguaNigerNigeriaNorth AmericaNorwayOECD membersOmanOther small statesPakistanPanamaPapua New GuineaParaguayPeruPhilippinesPolandPortugalPost-demographic dividendPre-demographic dividendPuerto RicoQatarRomaniaRussian FederationRwandaSaudi ArabiaSenegalSerbiaSeychellesSierra LeoneSingaporeSlovak RepublicSloveniaSmall statesSolomon IslandsSouth AfricaSouth AsiaSouth Asia (IDA & IBRD)South SudanSpainSri LankaSt. Kitts and NevisSt. LuciaSt. Vincent and the GrenadinesSub-Saharan Africa Sub-Saharan Africa (excluding high income)Sub-Saharan Africa (IDA & IBRD countries)SudanSurinameSwazilandSwedenSwitzerlandSyrian Arab RepublicTajikistanTanzaniaThailandTimor-LesteTogoTongaTrinidad and TobagoTunisiaTurkeyTurkmenistanUgandaUkraineUnited Arab EmiratesUnited KingdomUnited StatesUpper middle incomeUruguayUzbekistanVanuatuVenezuela, RBVietnamWest Bank and GazaWorldYemen, Rep.ZambiaZimbabwe Timeline:
This timeline shows a graph from 1961 to 2015 of Iran, Islamic Rep.. No data until 1960. Number of actual observations by date: 53.
Source name:
World Development Indicators
Source organization:
World Bank national accounts data, and OECD National Accounts data files.
Categories, topics:
Economy & Growth
Last updated:
apr 23, 2017
Indicators value changes by year
Minimum:
2.85 bln
jan 1, 1961
Maximum:
295.137 bln
jan 1, 2013
At the date of observation
Value
Absolute change
Change from previous value
jan 1, 1961
2.85 bln
+2.85 bln
0.0%
jan 1, 1962
2.943 bln
+93.08 mln
3.27%
jan 1, 1963
3.026 bln
+83.023 mln
2.82%
jan 1, 1964
3.291 bln
+264.981 mln
8.76%
jan 1, 1965
3.272 bln
-19.249 mln
-0.58%
jan 1, 1966
3.353 bln
+81.305 mln
2.48%
jan 1, 1967
3.549 bln
+195.918 mln
5.84%
jan 1, 1968
4.002 bln
+452.54 mln
12.75%
jan 1, 1969
3.956 bln
-45.88 mln
-1.15%
jan 1, 1970
4.496 bln
+540.188 mln
13.66%
jan 1, 1971
4.907 bln
+411.044 mln
9.14%
jan 1, 1972
6.142 bln
+1.235 bln
25.17%
jan 1, 1973
6.729 bln
+586.665 mln
9.55%
jan 1, 1974
9.443 bln
+2.714 bln
40.34%
jan 1, 1975
11.347 bln
+1.904 bln
20.16%
jan 1, 1976
15.226 bln
+3.879 bln
34.19%
jan 1, 1977
14.633 bln
-592.324 mln
-3.89%
jan 1, 1978
23.796 bln
+9.162 bln
62.61%
jan 1, 1979
28.311 bln
+4.515 bln
18.97%
jan 1, 1980
40.264 bln
+11.953 bln
42.22%
jan 1, 1981
43.517 bln
+3.253 bln
8.08%
jan 1, 1982
54.316 bln
+10.799 bln
24.82%
jan 1, 1983
73.838 bln
+19.522 bln
35.94%
jan 1, 1984
89.375 bln
+15.538 bln
21.04%
jan 1, 1985
92.74 bln
+3.365 bln
3.76%
jan 1, 1986
117.525 bln
+24.785 bln
26.73%
jan 1, 1987
144.743 bln
+27.217 bln
23.16%
jan 1, 1988
87.277 bln
-57.466 bln
-39.7%
jan 1, 1989
92.104 bln
+4.827 bln
5.53%
jan 1, 1990
88.266 bln
-3.838 bln
-4.17%
jan 1, 1991
83.194 bln
-5.072 bln
-5.75%
jan 1, 1994
32.251 bln
-50.943 bln
-61.23%
jan 1, 1995
34.045 bln
+1.794 bln
5.56%
jan 1, 1996
45.664 bln
+11.62 bln
34.13%
jan 1, 1997
53.793 bln
+8.128 bln
17.8%
jan 1, 1998
58.051 bln
+4.258 bln
7.92%
jan 1, 1999
62.806 bln
+4.755 bln
8.19%
jan 1, 2000
59.137 bln
-3.67 bln
-5.84%
jan 1, 2001
55.114 bln
-4.023 bln
-6.8%
jan 1, 2002
68.268 bln
+13.154 bln
23.87%
jan 1, 2003
62.479 bln
-5.789 bln
-8.48%
jan 1, 2004
73.547 bln
+11.068 bln
17.72%
jan 1, 2005
82.902 bln
+9.355 bln
12.72%
jan 1, 2006
98.053 bln
+15.152 bln
18.28%
jan 1, 2007
113.794 bln
+15.74 bln
16.05%
jan 1, 2008
151.491 bln
+37.697 bln
33.13%
jan 1, 2009
179.918 bln
+28.427 bln
18.76%
jan 1, 2010
193.062 bln
+13.144 bln
7.31%
jan 1, 2011
215.782 bln
+22.721 bln
11.77%
jan 1, 2012
271.144 bln
+55.362 bln
25.66%
jan 1, 2013
295.137 bln
+23.993 bln
8.85%
jan 1, 2014
254.732 bln
-40.405 bln
-13.69%
jan 1, 2015
215.347 bln
-39.386 bln
-15.46%
Ranking of countries by current statistics by years


Comments: