29
/
en
AIzaSyAYiBZKx7MnpbEhh9jyipgxe19OcubqV5w
April 1, 2024
89910
Botswana
BWA
true
2
1
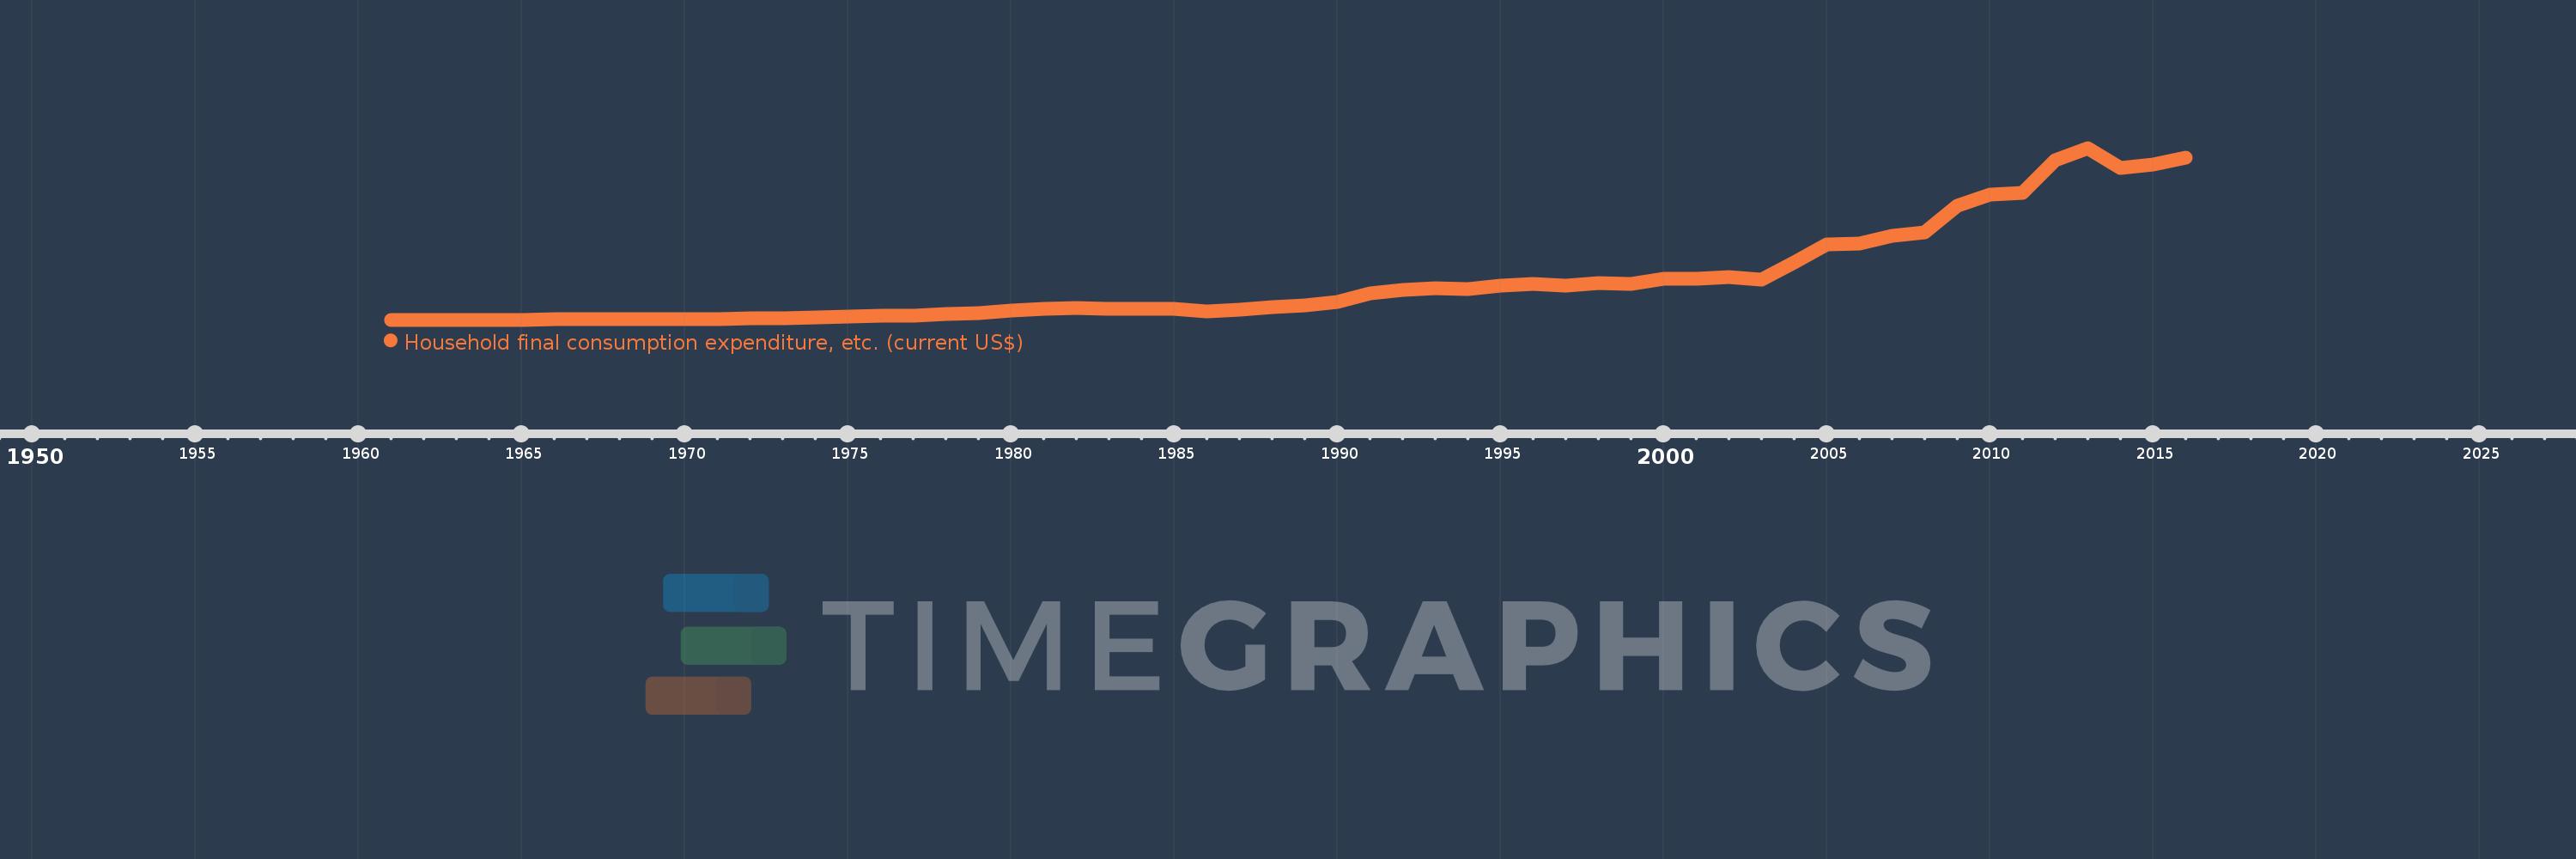
Household final consumption expenditure, etc. (current US$)
2016,2015,2014,2013,2012,2011,2010,2009,2008,2007,2006,2005,2004,2003,2002,2001,2000,1999,1998,1997,1996,1995,1994,1993,1992,1991,1990,1989,1988,1987,1986,1985,1984,1983,1982,1981,1980,1979,1978,1977,1976,1975,1974,1973,1972,1971,1970,1969,1968,1967,1966,1965,1964,1963,1962,1961
This statistics in other country:
AfghanistanAlbaniaAlgeriaAngolaAntigua and BarbudaArab WorldArgentinaArmeniaArubaAustraliaAustriaAzerbaijanBahamas, TheBahrainBangladeshBarbadosBelarusBelgiumBelizeBeninBermudaBhutanBoliviaBosnia and HerzegovinaBotswanaBrazilBrunei DarussalamBulgariaBurkina FasoBurundiCabo VerdeCambodiaCameroonCanadaCaribbean small statesCentral African RepublicCentral Europe and the BalticsChadChileChinaColombiaComorosCongo, Dem. Rep.Congo, Rep.Costa RicaCote d'IvoireCroatiaCubaCyprusCzech RepublicDenmarkDjiboutiDominicaDominican RepublicEarly-demographic dividendEast Asia & PacificEast Asia & Pacific (excluding high income)East Asia & Pacific (IDA & IBRD countries)EcuadorEgypt, Arab Rep.El SalvadorEquatorial GuineaEritreaEstoniaEthiopiaEuro areaEurope & Central AsiaEurope & Central Asia (excluding high income)Europe & Central Asia (IDA & IBRD countries)European UnionFaroe IslandsFijiFinlandFragile and conflict affected situationsFranceGabonGambia, TheGeorgiaGermanyGhanaGreeceGrenadaGuatemalaGuineaGuinea-BissauGuyanaHaitiHeavily indebted poor countries (HIPC)High incomeHondurasHong Kong SAR, ChinaHungaryIBRD onlyIcelandIDA & IBRD totalIDA blendIDA onlyIDA totalIndiaIndonesiaIran, Islamic Rep.IraqIrelandIsraelItalyJamaicaJapanJordanKazakhstanKenyaKiribatiKorea, Rep.KosovoKuwaitKyrgyz RepublicLao PDRLate-demographic dividendLatin America & Caribbean Latin America & Caribbean (excluding high income)Latin America & the Caribbean (IDA & IBRD countries)LatviaLeast developed countries: UN classificationLebanonLesothoLiberiaLibyaLithuaniaLow & middle incomeLow incomeLower middle incomeLuxembourgMacao SAR, ChinaMacedonia, FYRMadagascarMalawiMalaysiaMaldivesMaliMaltaMauritaniaMauritiusMexicoMicronesia, Fed. Sts.Middle East & North AfricaMiddle East & North Africa (excluding high income)Middle East & North Africa (IDA & IBRD countries)Middle incomeMoldovaMongoliaMontenegroMoroccoMozambiqueNamibiaNepalNetherlandsNew CaledoniaNew ZealandNicaraguaNigerNigeriaNorth AmericaNorwayOECD membersOmanOther small statesPakistanPanamaPapua New GuineaParaguayPeruPhilippinesPolandPortugalPost-demographic dividendPre-demographic dividendPuerto RicoQatarRomaniaRussian FederationRwandaSaudi ArabiaSenegalSerbiaSeychellesSierra LeoneSingaporeSlovak RepublicSloveniaSmall statesSolomon IslandsSouth AfricaSouth AsiaSouth Asia (IDA & IBRD)South SudanSpainSri LankaSt. Kitts and NevisSt. LuciaSt. Vincent and the GrenadinesSub-Saharan Africa Sub-Saharan Africa (excluding high income)Sub-Saharan Africa (IDA & IBRD countries)SudanSurinameSwazilandSwedenSwitzerlandSyrian Arab RepublicTajikistanTanzaniaThailandTimor-LesteTogoTongaTrinidad and TobagoTunisiaTurkeyTurkmenistanUgandaUkraineUnited Arab EmiratesUnited KingdomUnited StatesUpper middle incomeUruguayUzbekistanVanuatuVenezuela, RBVietnamWest Bank and GazaWorldYemen, Rep.ZambiaZimbabwe Timeline:
This timeline shows a graph from 1961 to 2016 of Botswana. No data until 1960. Number of actual observations by date: 56.
Source name:
World Development Indicators
Source organization:
World Bank national accounts data, and OECD National Accounts data files.
Categories, topics:
Economy & Growth
Last updated:
apr 23, 2017
Indicators value changes by year
Minimum:
27.132 mln
jan 1, 1961
Maximum:
8.056 bln
jan 1, 2013
At the date of observation
Value
Absolute change
Change from previous value
jan 1, 1961
27.132 mln
+27.132 mln
0.0%
jan 1, 1962
29.108 mln
+1.976 mln
7.28%
jan 1, 1963
31.083 mln
+1.976 mln
6.79%
jan 1, 1964
32.873 mln
+1.79 mln
5.76%
jan 1, 1965
34.946 mln
+2.073 mln
6.31%
jan 1, 1966
36.645 mln
+1.699 mln
4.86%
jan 1, 1967
37.867 mln
+1.222 mln
3.33%
jan 1, 1968
43.929 mln
+6.062 mln
16.01%
jan 1, 1969
56.625 mln
+12.696 mln
28.9%
jan 1, 1970
54.801 mln
-1.824 mln
-3.22%
jan 1, 1971
69.443 mln
+14.642 mln
26.72%
jan 1, 1972
78.228 mln
+8.785 mln
12.65%
jan 1, 1973
97.319 mln
+19.091 mln
24.4%
jan 1, 1974
140.899 mln
+43.58 mln
44.78%
jan 1, 1975
179.844 mln
+38.945 mln
27.64%
jan 1, 1976
210.681 mln
+30.836 mln
17.15%
jan 1, 1977
226.09 mln
+15.409 mln
7.31%
jan 1, 1978
279.051 mln
+52.961 mln
23.42%
jan 1, 1979
348.183 mln
+69.131 mln
24.77%
jan 1, 1980
446.806 mln
+98.623 mln
28.33%
jan 1, 1981
551.578 mln
+104.772 mln
23.45%
jan 1, 1982
575.688 mln
+24.11 mln
4.37%
jan 1, 1983
517.646 mln
-58.042 mln
-10.08%
jan 1, 1984
530.391 mln
+12.745 mln
2.46%
jan 1, 1985
529.778 mln
-613.088K
-0.12%
jan 1, 1986
434.361 mln
-95.418 mln
-18.01%
jan 1, 1987
492.219 mln
+57.858 mln
13.32%
jan 1, 1988
607.556 mln
+115.337 mln
23.43%
jan 1, 1989
685.83 mln
+78.274 mln
12.88%
jan 1, 1990
867.766 mln
+181.936 mln
26.53%
jan 1, 1991
1.26 bln
+391.972 mln
45.17%
jan 1, 1992
1.422 bln
+162.056 mln
12.86%
jan 1, 1993
1.518 bln
+96.454 mln
6.78%
jan 1, 1994
1.466 bln
-52.218 mln
-3.44%
jan 1, 1995
1.616 bln
+149.517 mln
10.2%
jan 1, 1996
1.691 bln
+75.059 mln
4.65%
jan 1, 1997
1.632 bln
-58.786 mln
-3.48%
jan 1, 1998
1.737 bln
+105.606 mln
6.47%
jan 1, 1999
1.689 bln
-48.462 mln
-2.79%
jan 1, 2000
1.947 bln
+257.817 mln
15.26%
jan 1, 2001
1.957 bln
+10.096 mln
0.52%
jan 1, 2002
2.022 bln
+65.224 mln
3.33%
jan 1, 2003
1.901 bln
-121.33 mln
-6.0%
jan 1, 2004
2.706 bln
+805.547 mln
42.38%
jan 1, 2005
3.561 bln
+855.01 mln
31.59%
jan 1, 2006
3.586 bln
+24.523 mln
0.69%
jan 1, 2007
3.938 bln
+351.817 mln
9.81%
jan 1, 2008
4.122 bln
+184.751 mln
4.69%
jan 1, 2009
5.344 bln
+1.222 bln
29.64%
jan 1, 2010
5.859 bln
+514.437 mln
9.63%
jan 1, 2011
5.941 bln
+81.844 mln
1.4%
jan 1, 2012
7.482 bln
+1.542 bln
25.95%
jan 1, 2013
8.056 bln
+573.765 mln
7.67%
jan 1, 2014
7.137 bln
-919.49 mln
-11.41%
jan 1, 2015
7.29 bln
+153.469 mln
2.15%
jan 1, 2016
7.594 bln
+304.083 mln
4.17%
Ranking of countries by current statistics by years


Comments: