29
/
en
AIzaSyAYiBZKx7MnpbEhh9jyipgxe19OcubqV5w
April 1, 2024
209419
New Zealand
NZL
true
2
1
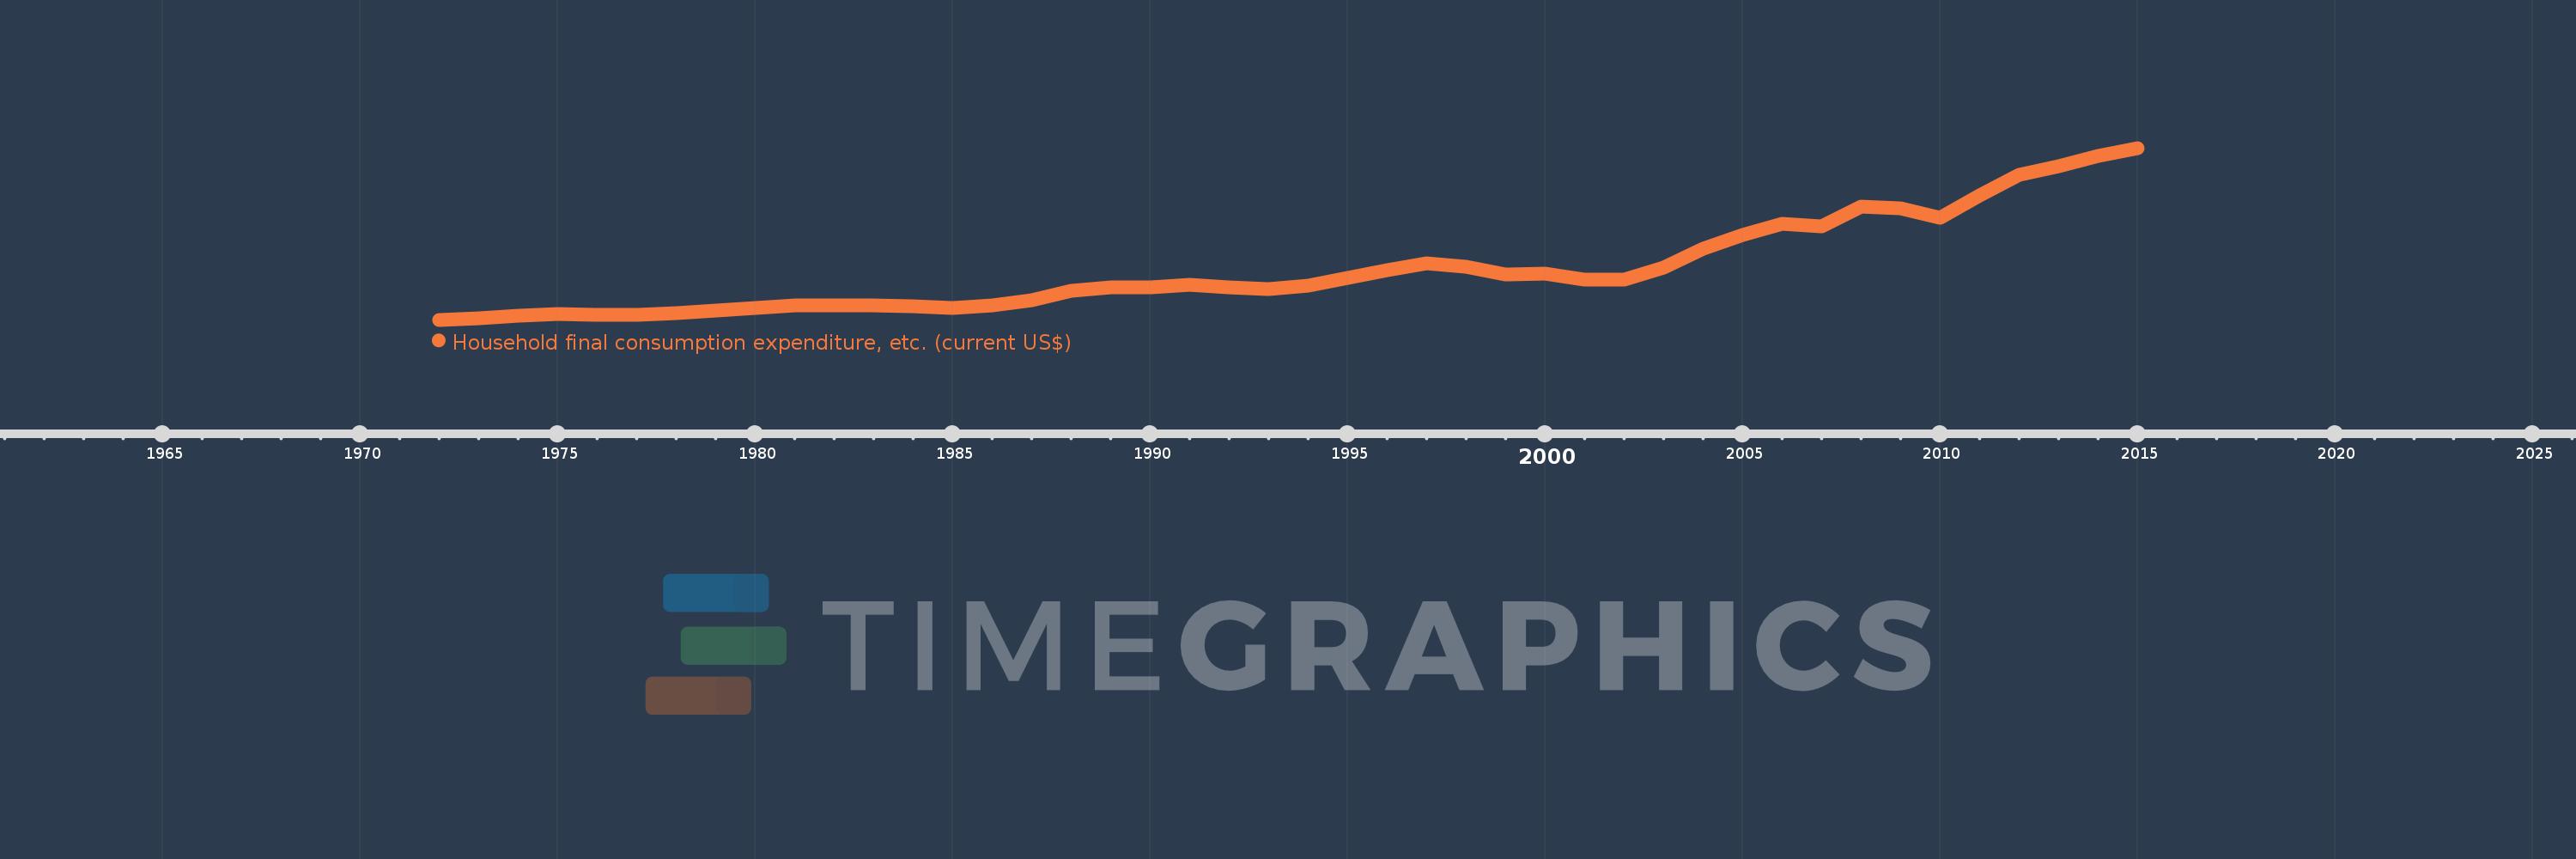
Household final consumption expenditure, etc. (current US$)
2015,2014,2013,2012,2011,2010,2009,2008,2007,2006,2005,2004,2003,2002,2001,2000,1999,1998,1997,1996,1995,1994,1993,1992,1991,1990,1989,1988,1987,1986,1985,1984,1983,1982,1981,1980,1979,1978,1977,1976,1975,1974,1973,1972
This statistics in other country:
AfghanistanAlbaniaAlgeriaAngolaAntigua and BarbudaArab WorldArgentinaArmeniaArubaAustraliaAustriaAzerbaijanBahamas, TheBahrainBangladeshBarbadosBelarusBelgiumBelizeBeninBermudaBhutanBoliviaBosnia and HerzegovinaBotswanaBrazilBrunei DarussalamBulgariaBurkina FasoBurundiCabo VerdeCambodiaCameroonCanadaCaribbean small statesCentral African RepublicCentral Europe and the BalticsChadChileChinaColombiaComorosCongo, Dem. Rep.Congo, Rep.Costa RicaCote d'IvoireCroatiaCubaCyprusCzech RepublicDenmarkDjiboutiDominicaDominican RepublicEarly-demographic dividendEast Asia & PacificEast Asia & Pacific (excluding high income)East Asia & Pacific (IDA & IBRD countries)EcuadorEgypt, Arab Rep.El SalvadorEquatorial GuineaEritreaEstoniaEthiopiaEuro areaEurope & Central AsiaEurope & Central Asia (excluding high income)Europe & Central Asia (IDA & IBRD countries)European UnionFaroe IslandsFijiFinlandFragile and conflict affected situationsFranceGabonGambia, TheGeorgiaGermanyGhanaGreeceGrenadaGuatemalaGuineaGuinea-BissauGuyanaHaitiHeavily indebted poor countries (HIPC)High incomeHondurasHong Kong SAR, ChinaHungaryIBRD onlyIcelandIDA & IBRD totalIDA blendIDA onlyIDA totalIndiaIndonesiaIran, Islamic Rep.IraqIrelandIsraelItalyJamaicaJapanJordanKazakhstanKenyaKiribatiKorea, Rep.KosovoKuwaitKyrgyz RepublicLao PDRLate-demographic dividendLatin America & Caribbean Latin America & Caribbean (excluding high income)Latin America & the Caribbean (IDA & IBRD countries)LatviaLeast developed countries: UN classificationLebanonLesothoLiberiaLibyaLithuaniaLow & middle incomeLow incomeLower middle incomeLuxembourgMacao SAR, ChinaMacedonia, FYRMadagascarMalawiMalaysiaMaldivesMaliMaltaMauritaniaMauritiusMexicoMicronesia, Fed. Sts.Middle East & North AfricaMiddle East & North Africa (excluding high income)Middle East & North Africa (IDA & IBRD countries)Middle incomeMoldovaMongoliaMontenegroMoroccoMozambiqueNamibiaNepalNetherlandsNew CaledoniaNew ZealandNicaraguaNigerNigeriaNorth AmericaNorwayOECD membersOmanOther small statesPakistanPanamaPapua New GuineaParaguayPeruPhilippinesPolandPortugalPost-demographic dividendPre-demographic dividendPuerto RicoQatarRomaniaRussian FederationRwandaSaudi ArabiaSenegalSerbiaSeychellesSierra LeoneSingaporeSlovak RepublicSloveniaSmall statesSolomon IslandsSouth AfricaSouth AsiaSouth Asia (IDA & IBRD)South SudanSpainSri LankaSt. Kitts and NevisSt. LuciaSt. Vincent and the GrenadinesSub-Saharan Africa Sub-Saharan Africa (excluding high income)Sub-Saharan Africa (IDA & IBRD countries)SudanSurinameSwazilandSwedenSwitzerlandSyrian Arab RepublicTajikistanTanzaniaThailandTimor-LesteTogoTongaTrinidad and TobagoTunisiaTurkeyTurkmenistanUgandaUkraineUnited Arab EmiratesUnited KingdomUnited StatesUpper middle incomeUruguayUzbekistanVanuatuVenezuela, RBVietnamWest Bank and GazaWorldYemen, Rep.ZambiaZimbabwe Timeline:
This timeline shows a graph from 1972 to 2015 of New Zealand. No data until 1971. Number of actual observations by date: 44.
Source name:
World Development Indicators
Source organization:
World Bank national accounts data, and OECD National Accounts data files.
Categories, topics:
Economy & Growth
Last updated:
apr 23, 2017
Indicators value changes by year
Minimum:
4.746 bln
jan 1, 1972
Maximum:
116.099 bln
jan 1, 2015
At the date of observation
Value
Absolute change
Change from previous value
jan 1, 1972
4.746 bln
+4.746 bln
0.0%
jan 1, 1973
5.577 bln
+831.769 mln
17.53%
jan 1, 1974
7.443 bln
+1.865 bln
33.44%
jan 1, 1975
8.5 bln
+1.057 bln
14.2%
jan 1, 1976
7.951 bln
-548.516 mln
-6.45%
jan 1, 1977
8.022 bln
+71.005 mln
0.89%
jan 1, 1978
9.095 bln
+1.073 bln
13.38%
jan 1, 1979
10.811 bln
+1.716 bln
18.86%
jan 1, 1980
12.321 bln
+1.51 bln
13.97%
jan 1, 1981
13.949 bln
+1.628 bln
13.21%
jan 1, 1982
14.301 bln
+352.013 mln
2.52%
jan 1, 1983
13.861 bln
-440.169 mln
-3.08%
jan 1, 1984
13.624 bln
-237.072 mln
-1.71%
jan 1, 1985
12.109 bln
-1.515 bln
-11.12%
jan 1, 1986
14.127 bln
+2.019 bln
16.67%
jan 1, 1987
17.342 bln
+3.215 bln
22.76%
jan 1, 1988
23.252 bln
+5.91 bln
34.08%
jan 1, 1989
25.901 bln
+2.65 bln
11.4%
jan 1, 1990
25.519 bln
-382.126 mln
-1.48%
jan 1, 1991
27.373 bln
+1.854 bln
7.27%
jan 1, 1992
25.679 bln
-1.695 bln
-6.19%
jan 1, 1993
24.71 bln
-968.366 mln
-3.77%
jan 1, 1994
26.845 bln
+2.135 bln
8.64%
jan 1, 1995
32.018 bln
+5.173 bln
19.27%
jan 1, 1996
36.864 bln
+4.845 bln
15.13%
jan 1, 1997
41.131 bln
+4.267 bln
11.58%
jan 1, 1998
38.88 bln
-2.251 bln
-5.47%
jan 1, 1999
33.949 bln
-4.931 bln
-12.68%
jan 1, 2000
34.704 bln
+755.292 mln
2.22%
jan 1, 2001
30.512 bln
-4.193 bln
-12.08%
jan 1, 2002
30.495 bln
-16.844 mln
-0.06%
jan 1, 2003
38.339 bln
+7.844 bln
25.72%
jan 1, 2004
50.641 bln
+12.302 bln
32.09%
jan 1, 2005
59.694 bln
+9.053 bln
17.88%
jan 1, 2006
66.741 bln
+7.047 bln
11.8%
jan 1, 2007
65.174 bln
-1.567 bln
-2.35%
jan 1, 2008
78.027 bln
+12.853 bln
19.72%
jan 1, 2009
77.218 bln
-809.52 mln
-1.04%
jan 1, 2010
70.827 bln
-6.391 bln
-8.28%
jan 1, 2011
85.128 bln
+14.301 bln
20.19%
jan 1, 2012
98.704 bln
+13.576 bln
15.95%
jan 1, 2013
104.346 bln
+5.642 bln
5.72%
jan 1, 2014
110.82 bln
+6.475 bln
6.2%
jan 1, 2015
116.099 bln
+5.278 bln
4.76%
Ranking of countries by current statistics by years


Comments: