29
/
en
AIzaSyAYiBZKx7MnpbEhh9jyipgxe19OcubqV5w
April 1, 2024
39060
IDA only
IDX
false
2
1
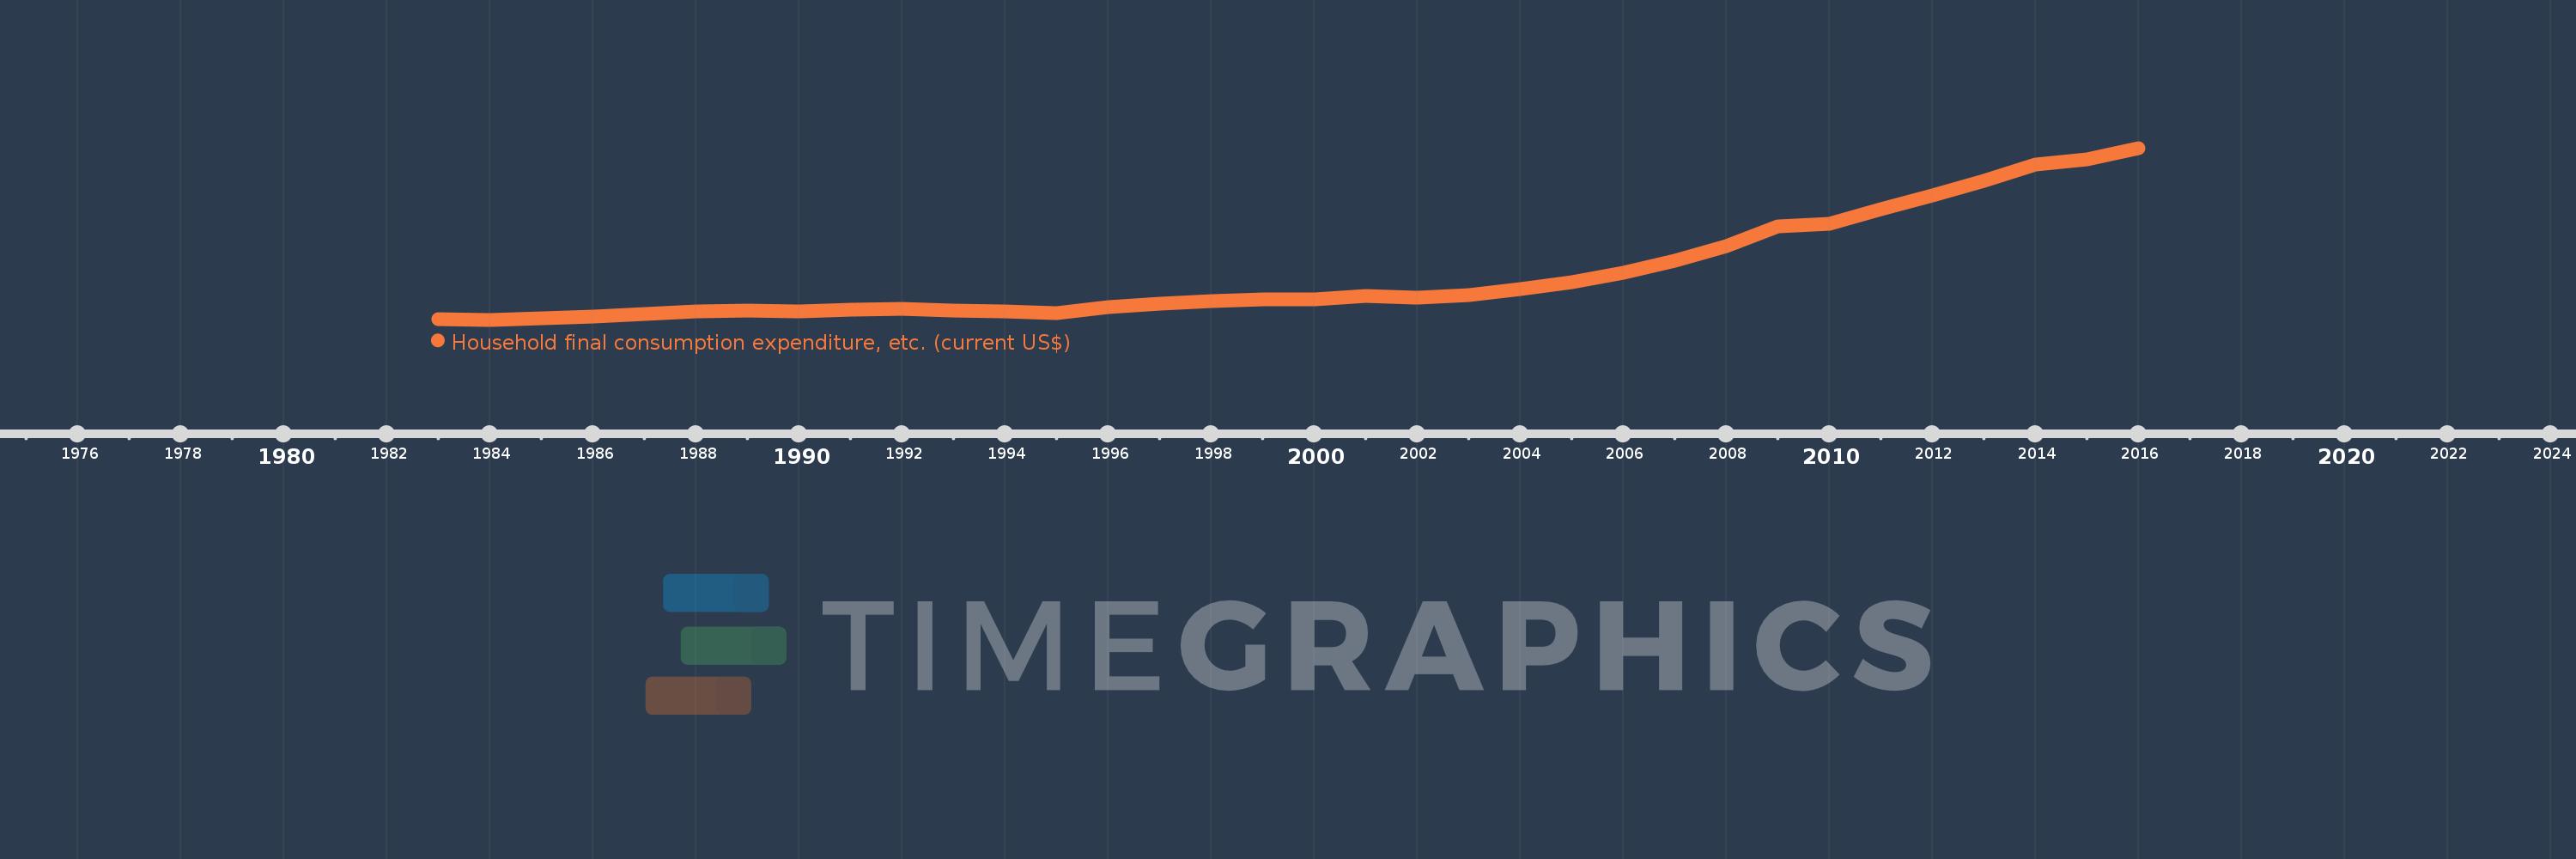
Household final consumption expenditure, etc. (current US$)
2016,2015,2014,2013,2012,2011,2010,2009,2008,2007,2006,2005,2004,2003,2002,2001,2000,1999,1998,1997,1996,1995,1994,1993,1992,1991,1990,1989,1988,1987,1986,1985,1984,1983
This statistics in other country:
AfghanistanAlbaniaAlgeriaAngolaAntigua and BarbudaArab WorldArgentinaArmeniaArubaAustraliaAustriaAzerbaijanBahamas, TheBahrainBangladeshBarbadosBelarusBelgiumBelizeBeninBermudaBhutanBoliviaBosnia and HerzegovinaBotswanaBrazilBrunei DarussalamBulgariaBurkina FasoBurundiCabo VerdeCambodiaCameroonCanadaCaribbean small statesCentral African RepublicCentral Europe and the BalticsChadChileChinaColombiaComorosCongo, Dem. Rep.Congo, Rep.Costa RicaCote d'IvoireCroatiaCubaCyprusCzech RepublicDenmarkDjiboutiDominicaDominican RepublicEarly-demographic dividendEast Asia & PacificEast Asia & Pacific (excluding high income)East Asia & Pacific (IDA & IBRD countries)EcuadorEgypt, Arab Rep.El SalvadorEquatorial GuineaEritreaEstoniaEthiopiaEuro areaEurope & Central AsiaEurope & Central Asia (excluding high income)Europe & Central Asia (IDA & IBRD countries)European UnionFaroe IslandsFijiFinlandFragile and conflict affected situationsFranceGabonGambia, TheGeorgiaGermanyGhanaGreeceGrenadaGuatemalaGuineaGuinea-BissauGuyanaHaitiHeavily indebted poor countries (HIPC)High incomeHondurasHong Kong SAR, ChinaHungaryIBRD onlyIcelandIDA & IBRD totalIDA blendIDA onlyIDA totalIndiaIndonesiaIran, Islamic Rep.IraqIrelandIsraelItalyJamaicaJapanJordanKazakhstanKenyaKiribatiKorea, Rep.KosovoKuwaitKyrgyz RepublicLao PDRLate-demographic dividendLatin America & Caribbean Latin America & Caribbean (excluding high income)Latin America & the Caribbean (IDA & IBRD countries)LatviaLeast developed countries: UN classificationLebanonLesothoLiberiaLibyaLithuaniaLow & middle incomeLow incomeLower middle incomeLuxembourgMacao SAR, ChinaMacedonia, FYRMadagascarMalawiMalaysiaMaldivesMaliMaltaMauritaniaMauritiusMexicoMicronesia, Fed. Sts.Middle East & North AfricaMiddle East & North Africa (excluding high income)Middle East & North Africa (IDA & IBRD countries)Middle incomeMoldovaMongoliaMontenegroMoroccoMozambiqueNamibiaNepalNetherlandsNew CaledoniaNew ZealandNicaraguaNigerNigeriaNorth AmericaNorwayOECD membersOmanOther small statesPakistanPanamaPapua New GuineaParaguayPeruPhilippinesPolandPortugalPost-demographic dividendPre-demographic dividendPuerto RicoQatarRomaniaRussian FederationRwandaSaudi ArabiaSenegalSerbiaSeychellesSierra LeoneSingaporeSlovak RepublicSloveniaSmall statesSolomon IslandsSouth AfricaSouth AsiaSouth Asia (IDA & IBRD)South SudanSpainSri LankaSt. Kitts and NevisSt. LuciaSt. Vincent and the GrenadinesSub-Saharan Africa Sub-Saharan Africa (excluding high income)Sub-Saharan Africa (IDA & IBRD countries)SudanSurinameSwazilandSwedenSwitzerlandSyrian Arab RepublicTajikistanTanzaniaThailandTimor-LesteTogoTongaTrinidad and TobagoTunisiaTurkeyTurkmenistanUgandaUkraineUnited Arab EmiratesUnited KingdomUnited StatesUpper middle incomeUruguayUzbekistanVanuatuVenezuela, RBVietnamWest Bank and GazaWorldYemen, Rep.ZambiaZimbabwe Timeline:
This timeline shows a graph from 1983 to 2016 of IDA only. No data until 1982. Number of actual observations by date: 34.
Source name:
World Development Indicators
Source organization:
World Bank national accounts data, and OECD National Accounts data files.
Categories, topics:
Economy & Growth
Last updated:
apr 23, 2017
Indicators value changes by year
Minimum:
118.251 bln
jan 1, 1984
Maximum:
851.092 bln
jan 1, 2016
At the date of observation
Value
Absolute change
Change from previous value
jan 1, 1983
122.609 bln
+122.609 bln
0.0%
jan 1, 1984
118.251 bln
-4.359 bln
-3.55%
jan 1, 1985
123.286 bln
+5.036 bln
4.26%
jan 1, 1986
131.531 bln
+8.245 bln
6.69%
jan 1, 1987
141.926 bln
+10.395 bln
7.9%
jan 1, 1988
154.717 bln
+12.791 bln
9.01%
jan 1, 1989
158.656 bln
+3.938 bln
2.55%
jan 1, 1990
155.068 bln
-3.587 bln
-2.26%
jan 1, 1991
161.76 bln
+6.692 bln
4.32%
jan 1, 1992
163.956 bln
+2.196 bln
1.36%
jan 1, 1993
157.026 bln
-6.93 bln
-4.23%
jan 1, 1994
154.934 bln
-2.091 bln
-1.33%
jan 1, 1995
146.216 bln
-8.718 bln
-5.63%
jan 1, 1996
170.436 bln
+24.22 bln
16.56%
jan 1, 1997
188.125 bln
+17.688 bln
10.38%
jan 1, 1998
196.685 bln
+8.56 bln
4.55%
jan 1, 1999
204.64 bln
+7.955 bln
4.04%
jan 1, 2000
204.274 bln
-366.1 mln
-0.18%
jan 1, 2001
217.984 bln
+13.71 bln
6.71%
jan 1, 2002
212.143 bln
-5.841 bln
-2.68%
jan 1, 2003
224.289 bln
+12.146 bln
5.73%
jan 1, 2004
247.731 bln
+23.442 bln
10.45%
jan 1, 2005
279.122 bln
+31.391 bln
12.67%
jan 1, 2006
320.339 bln
+41.218 bln
14.77%
jan 1, 2007
370.33 bln
+49.99 bln
15.61%
jan 1, 2008
431.388 bln
+61.059 bln
16.49%
jan 1, 2009
514.987 bln
+83.598 bln
19.38%
jan 1, 2010
528.461 bln
+13.475 bln
2.62%
jan 1, 2011
590.247 bln
+61.786 bln
11.69%
jan 1, 2012
648.993 bln
+58.746 bln
9.95%
jan 1, 2013
712.544 bln
+63.551 bln
9.79%
jan 1, 2014
779.822 bln
+67.278 bln
9.44%
jan 1, 2015
801.955 bln
+22.133 bln
2.84%
jan 1, 2016
851.092 bln
+49.137 bln
6.13%
Ranking of countries by current statistics by years


Comments: