29
/
en
AIzaSyAYiBZKx7MnpbEhh9jyipgxe19OcubqV5w
April 1, 2024
58167
South Asia (IDA & IBRD)
TSA
false
2
1
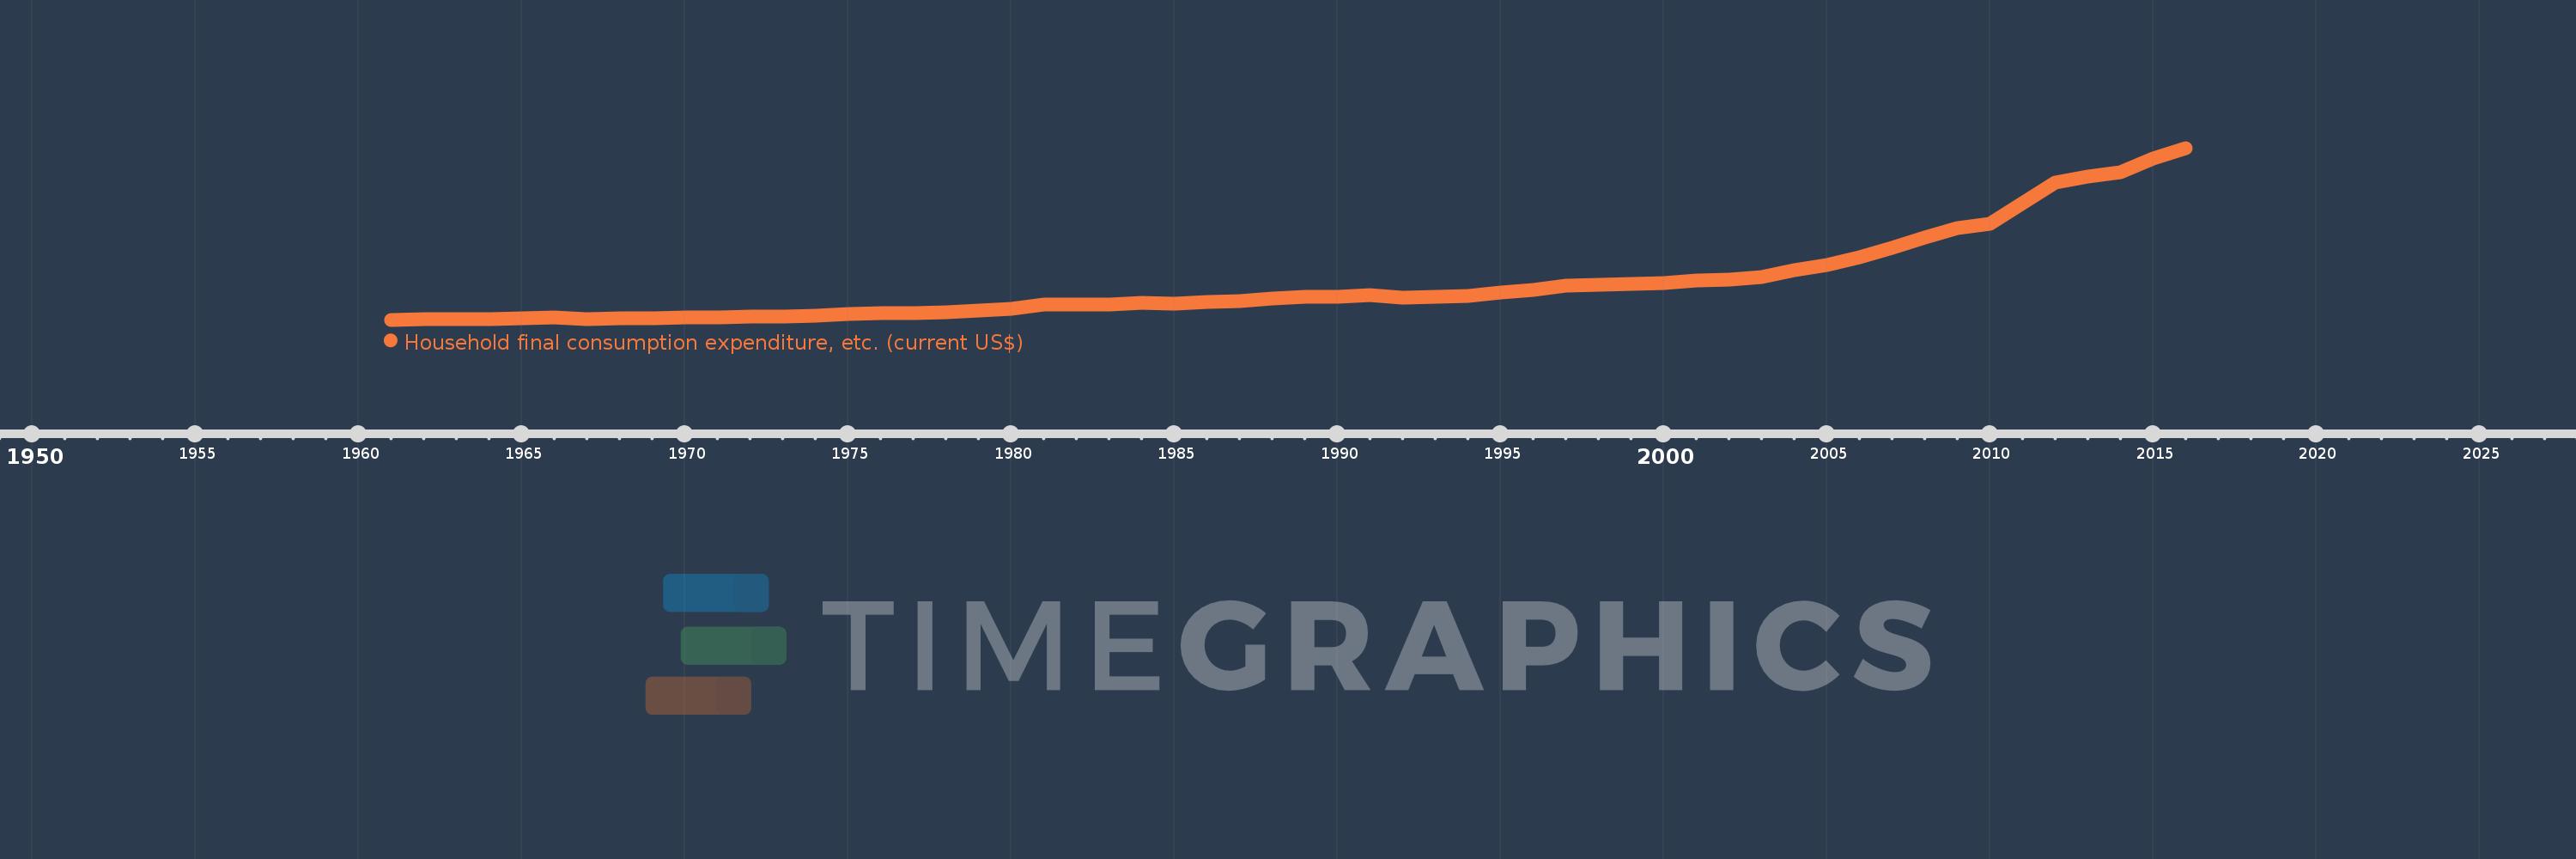
Household final consumption expenditure, etc. (current US$)
2016,2015,2014,2013,2012,2011,2010,2009,2008,2007,2006,2005,2004,2003,2002,2001,2000,1999,1998,1997,1996,1995,1994,1993,1992,1991,1990,1989,1988,1987,1986,1985,1984,1983,1982,1981,1980,1979,1978,1977,1976,1975,1974,1973,1972,1971,1970,1969,1968,1967,1966,1965,1964,1963,1962,1961
This statistics in other country:
AfghanistanAlbaniaAlgeriaAngolaAntigua and BarbudaArab WorldArgentinaArmeniaArubaAustraliaAustriaAzerbaijanBahamas, TheBahrainBangladeshBarbadosBelarusBelgiumBelizeBeninBermudaBhutanBoliviaBosnia and HerzegovinaBotswanaBrazilBrunei DarussalamBulgariaBurkina FasoBurundiCabo VerdeCambodiaCameroonCanadaCaribbean small statesCentral African RepublicCentral Europe and the BalticsChadChileChinaColombiaComorosCongo, Dem. Rep.Congo, Rep.Costa RicaCote d'IvoireCroatiaCubaCyprusCzech RepublicDenmarkDjiboutiDominicaDominican RepublicEarly-demographic dividendEast Asia & PacificEast Asia & Pacific (excluding high income)East Asia & Pacific (IDA & IBRD countries)EcuadorEgypt, Arab Rep.El SalvadorEquatorial GuineaEritreaEstoniaEthiopiaEuro areaEurope & Central AsiaEurope & Central Asia (excluding high income)Europe & Central Asia (IDA & IBRD countries)European UnionFaroe IslandsFijiFinlandFragile and conflict affected situationsFranceGabonGambia, TheGeorgiaGermanyGhanaGreeceGrenadaGuatemalaGuineaGuinea-BissauGuyanaHaitiHeavily indebted poor countries (HIPC)High incomeHondurasHong Kong SAR, ChinaHungaryIBRD onlyIcelandIDA & IBRD totalIDA blendIDA onlyIDA totalIndiaIndonesiaIran, Islamic Rep.IraqIrelandIsraelItalyJamaicaJapanJordanKazakhstanKenyaKiribatiKorea, Rep.KosovoKuwaitKyrgyz RepublicLao PDRLate-demographic dividendLatin America & Caribbean Latin America & Caribbean (excluding high income)Latin America & the Caribbean (IDA & IBRD countries)LatviaLeast developed countries: UN classificationLebanonLesothoLiberiaLibyaLithuaniaLow & middle incomeLow incomeLower middle incomeLuxembourgMacao SAR, ChinaMacedonia, FYRMadagascarMalawiMalaysiaMaldivesMaliMaltaMauritaniaMauritiusMexicoMicronesia, Fed. Sts.Middle East & North AfricaMiddle East & North Africa (excluding high income)Middle East & North Africa (IDA & IBRD countries)Middle incomeMoldovaMongoliaMontenegroMoroccoMozambiqueNamibiaNepalNetherlandsNew CaledoniaNew ZealandNicaraguaNigerNigeriaNorth AmericaNorwayOECD membersOmanOther small statesPakistanPanamaPapua New GuineaParaguayPeruPhilippinesPolandPortugalPost-demographic dividendPre-demographic dividendPuerto RicoQatarRomaniaRussian FederationRwandaSaudi ArabiaSenegalSerbiaSeychellesSierra LeoneSingaporeSlovak RepublicSloveniaSmall statesSolomon IslandsSouth AfricaSouth AsiaSouth Asia (IDA & IBRD)South SudanSpainSri LankaSt. Kitts and NevisSt. LuciaSt. Vincent and the GrenadinesSub-Saharan Africa Sub-Saharan Africa (excluding high income)Sub-Saharan Africa (IDA & IBRD countries)SudanSurinameSwazilandSwedenSwitzerlandSyrian Arab RepublicTajikistanTanzaniaThailandTimor-LesteTogoTongaTrinidad and TobagoTunisiaTurkeyTurkmenistanUgandaUkraineUnited Arab EmiratesUnited KingdomUnited StatesUpper middle incomeUruguayUzbekistanVanuatuVenezuela, RBVietnamWest Bank and GazaWorldYemen, Rep.ZambiaZimbabwe Timeline:
This timeline shows a graph from 1961 to 2016 of South Asia (IDA & IBRD). No data until 1960. Number of actual observations by date: 56.
Source name:
World Development Indicators
Source organization:
World Bank national accounts data, and OECD National Accounts data files.
Categories, topics:
Economy & Growth
Last updated:
apr 23, 2017
Indicators value changes by year
Minimum:
39.872 bln
jan 1, 1961
Maximum:
1.705 trl
jan 1, 2016
At the date of observation
Value
Absolute change
Change from previous value
jan 1, 1961
39.872 bln
+39.872 bln
0.0%
jan 1, 1962
41.834 bln
+1.961 bln
4.92%
jan 1, 1963
43.781 bln
+1.947 bln
4.65%
jan 1, 1964
49.03 bln
+5.249 bln
11.99%
jan 1, 1965
56.743 bln
+7.713 bln
15.73%
jan 1, 1966
59.285 bln
+2.542 bln
4.48%
jan 1, 1967
48.102 bln
-11.183 bln
-18.86%
jan 1, 1968
53.381 bln
+5.279 bln
10.97%
jan 1, 1969
55.664 bln
+2.283 bln
4.28%
jan 1, 1970
60.599 bln
+4.935 bln
8.87%
jan 1, 1971
65.106 bln
+4.507 bln
7.44%
jan 1, 1972
68.273 bln
+3.168 bln
4.87%
jan 1, 1973
71.197 bln
+2.924 bln
4.28%
jan 1, 1974
81.905 bln
+10.708 bln
15.04%
jan 1, 1975
98.776 bln
+16.871 bln
20.6%
jan 1, 1976
106.509 bln
+7.733 bln
7.83%
jan 1, 1977
99.973 bln
-6.536 bln
-6.14%
jan 1, 1978
114.963 bln
+14.99 bln
14.99%
jan 1, 1979
129.77 bln
+14.807 bln
12.88%
jan 1, 1980
145.535 bln
+15.765 bln
12.15%
jan 1, 1981
185.097 bln
+39.562 bln
27.18%
jan 1, 1982
187.215 bln
+2.117 bln
1.14%
jan 1, 1983
191.231 bln
+4.017 bln
2.15%
jan 1, 1984
205.517 bln
+14.286 bln
7.47%
jan 1, 1985
199.747 bln
-5.77 bln
-2.81%
jan 1, 1986
213.455 bln
+13.708 bln
6.86%
jan 1, 1987
221.417 bln
+7.962 bln
3.73%
jan 1, 1988
244.365 bln
+22.948 bln
10.36%
jan 1, 1989
260.132 bln
+15.767 bln
6.45%
jan 1, 1990
261.033 bln
+901.204 mln
0.35%
jan 1, 1991
280.103 bln
+19.07 bln
7.31%
jan 1, 1992
251.123 bln
-28.98 bln
-10.35%
jan 1, 1993
263.991 bln
+12.868 bln
5.12%
jan 1, 1994
268.739 bln
+4.748 bln
1.8%
jan 1, 1995
300.017 bln
+31.279 bln
11.64%
jan 1, 1996
326.37 bln
+26.353 bln
8.78%
jan 1, 1997
374.346 bln
+47.976 bln
14.7%
jan 1, 1998
378.995 bln
+4.649 bln
1.24%
jan 1, 1999
383.782 bln
+4.787 bln
1.26%
jan 1, 2000
397.319 bln
+13.536 bln
3.53%
jan 1, 2001
422.828 bln
+25.51 bln
6.42%
jan 1, 2002
428.585 bln
+5.757 bln
1.36%
jan 1, 2003
452.721 bln
+24.135 bln
5.63%
jan 1, 2004
522.052 bln
+69.331 bln
15.31%
jan 1, 2005
570.118 bln
+48.066 bln
9.21%
jan 1, 2006
648.294 bln
+78.176 bln
13.71%
jan 1, 2007
735.844 bln
+87.55 bln
13.5%
jan 1, 2008
840.773 bln
+104.928 bln
14.26%
jan 1, 2009
928.659 bln
+87.886 bln
10.45%
jan 1, 2010
967.006 bln
+38.347 bln
4.13%
jan 1, 2011
1.17 trl
+203.049 bln
21.0%
jan 1, 2012
1.371 trl
+201.109 bln
17.19%
jan 1, 2013
1.425 trl
+53.396 bln
3.89%
jan 1, 2014
1.471 trl
+46.27 bln
3.25%
jan 1, 2015
1.601 trl
+130.361 bln
8.86%
jan 1, 2016
1.705 trl
+104.076 bln
6.5%
Ranking of countries by current statistics by years


Comments: