29
/
en
AIzaSyAYiBZKx7MnpbEhh9jyipgxe19OcubqV5w
April 1, 2024
69915
Argentina
ARG
true
2
1
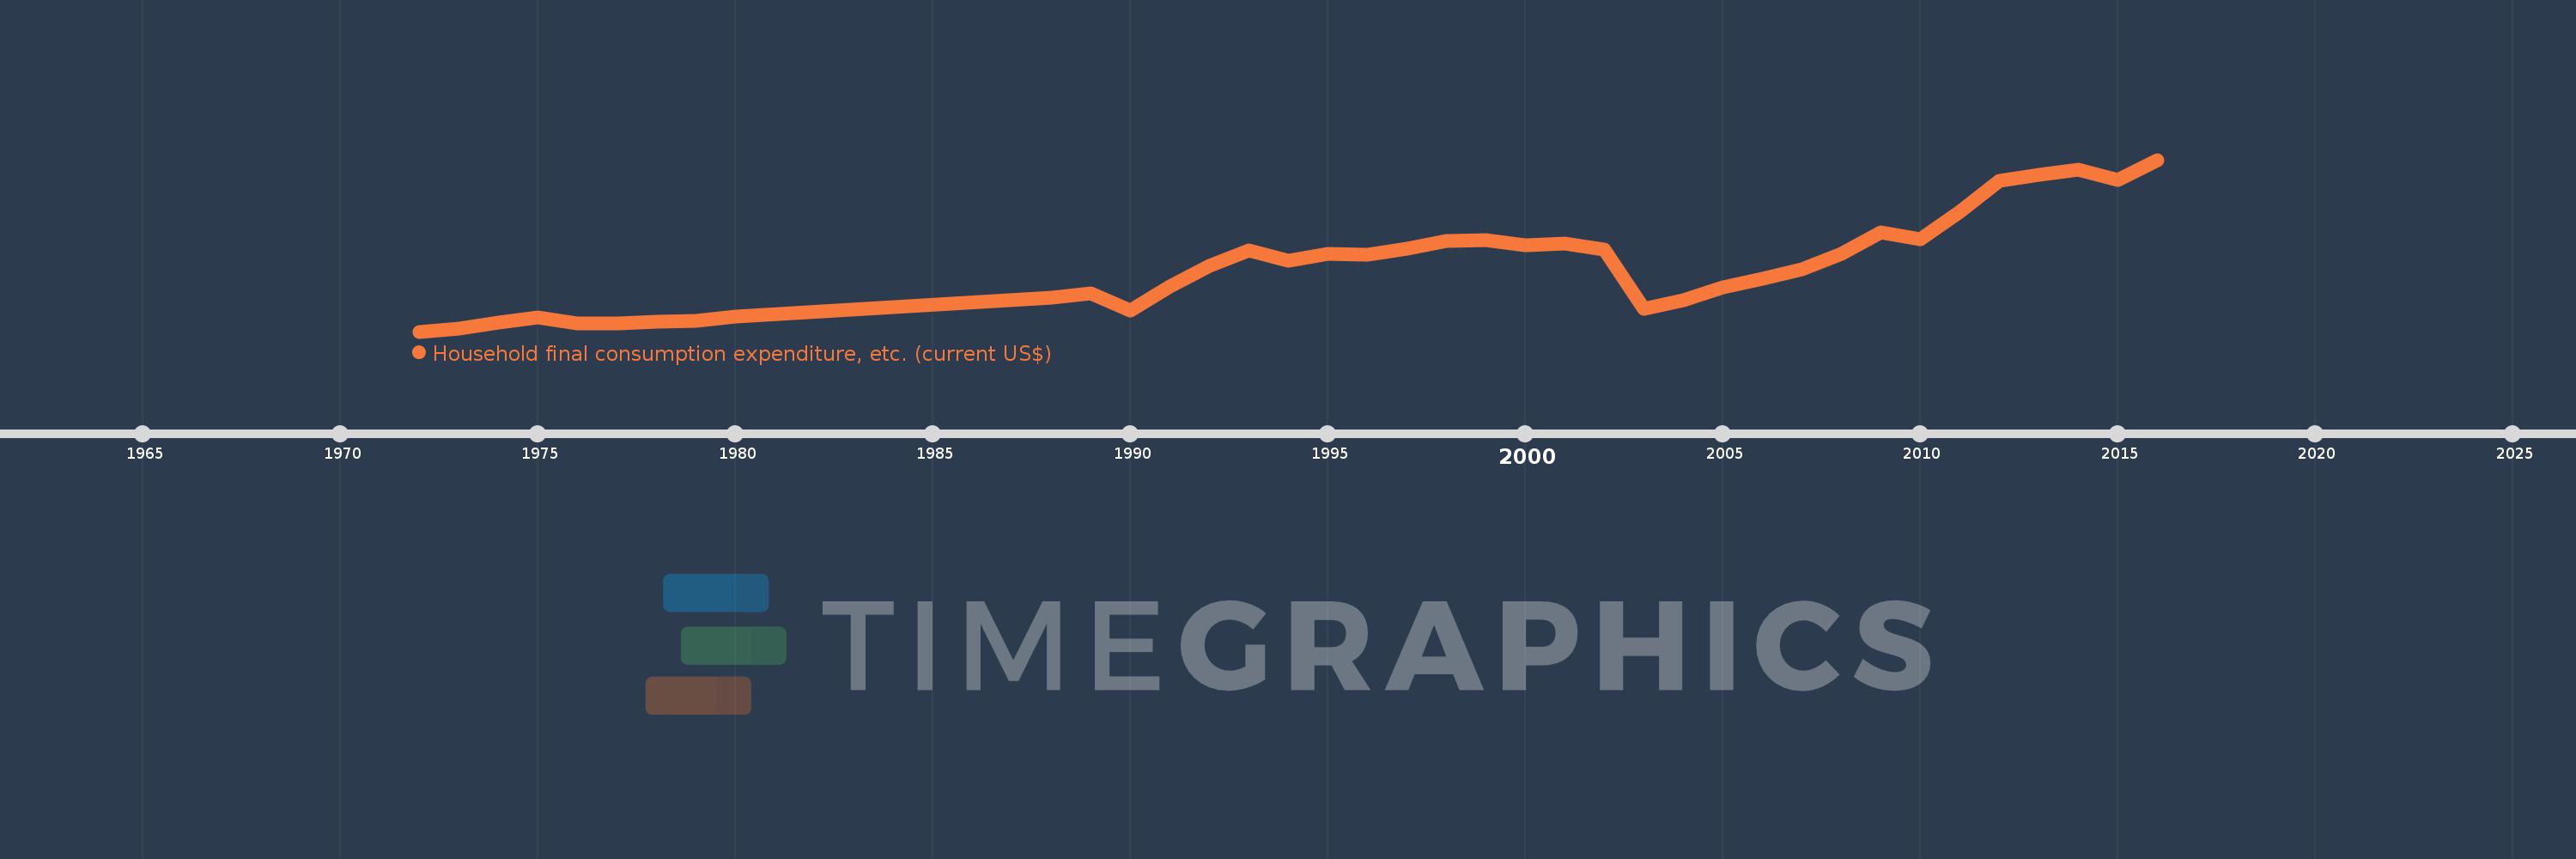
Household final consumption expenditure, etc. (current US$)
2016,2015,2014,2013,2012,2011,2010,2009,2008,2007,2006,2005,2004,2003,2002,2001,2000,1999,1998,1997,1996,1995,1994,1993,1992,1991,1990,1989,1988,1980,1979,1978,1977,1976,1975,1974,1973,1972
This statistics in other country:
AfghanistanAlbaniaAlgeriaAngolaAntigua and BarbudaArab WorldArgentinaArmeniaArubaAustraliaAustriaAzerbaijanBahamas, TheBahrainBangladeshBarbadosBelarusBelgiumBelizeBeninBermudaBhutanBoliviaBosnia and HerzegovinaBotswanaBrazilBrunei DarussalamBulgariaBurkina FasoBurundiCabo VerdeCambodiaCameroonCanadaCaribbean small statesCentral African RepublicCentral Europe and the BalticsChadChileChinaColombiaComorosCongo, Dem. Rep.Congo, Rep.Costa RicaCote d'IvoireCroatiaCubaCyprusCzech RepublicDenmarkDjiboutiDominicaDominican RepublicEarly-demographic dividendEast Asia & PacificEast Asia & Pacific (excluding high income)East Asia & Pacific (IDA & IBRD countries)EcuadorEgypt, Arab Rep.El SalvadorEquatorial GuineaEritreaEstoniaEthiopiaEuro areaEurope & Central AsiaEurope & Central Asia (excluding high income)Europe & Central Asia (IDA & IBRD countries)European UnionFaroe IslandsFijiFinlandFragile and conflict affected situationsFranceGabonGambia, TheGeorgiaGermanyGhanaGreeceGrenadaGuatemalaGuineaGuinea-BissauGuyanaHaitiHeavily indebted poor countries (HIPC)High incomeHondurasHong Kong SAR, ChinaHungaryIBRD onlyIcelandIDA & IBRD totalIDA blendIDA onlyIDA totalIndiaIndonesiaIran, Islamic Rep.IraqIrelandIsraelItalyJamaicaJapanJordanKazakhstanKenyaKiribatiKorea, Rep.KosovoKuwaitKyrgyz RepublicLao PDRLate-demographic dividendLatin America & Caribbean Latin America & Caribbean (excluding high income)Latin America & the Caribbean (IDA & IBRD countries)LatviaLeast developed countries: UN classificationLebanonLesothoLiberiaLibyaLithuaniaLow & middle incomeLow incomeLower middle incomeLuxembourgMacao SAR, ChinaMacedonia, FYRMadagascarMalawiMalaysiaMaldivesMaliMaltaMauritaniaMauritiusMexicoMicronesia, Fed. Sts.Middle East & North AfricaMiddle East & North Africa (excluding high income)Middle East & North Africa (IDA & IBRD countries)Middle incomeMoldovaMongoliaMontenegroMoroccoMozambiqueNamibiaNepalNetherlandsNew CaledoniaNew ZealandNicaraguaNigerNigeriaNorth AmericaNorwayOECD membersOmanOther small statesPakistanPanamaPapua New GuineaParaguayPeruPhilippinesPolandPortugalPost-demographic dividendPre-demographic dividendPuerto RicoQatarRomaniaRussian FederationRwandaSaudi ArabiaSenegalSerbiaSeychellesSierra LeoneSingaporeSlovak RepublicSloveniaSmall statesSolomon IslandsSouth AfricaSouth AsiaSouth Asia (IDA & IBRD)South SudanSpainSri LankaSt. Kitts and NevisSt. LuciaSt. Vincent and the GrenadinesSub-Saharan Africa Sub-Saharan Africa (excluding high income)Sub-Saharan Africa (IDA & IBRD countries)SudanSurinameSwazilandSwedenSwitzerlandSyrian Arab RepublicTajikistanTanzaniaThailandTimor-LesteTogoTongaTrinidad and TobagoTunisiaTurkeyTurkmenistanUgandaUkraineUnited Arab EmiratesUnited KingdomUnited StatesUpper middle incomeUruguayUzbekistanVanuatuVenezuela, RBVietnamWest Bank and GazaWorldYemen, Rep.ZambiaZimbabwe Timeline:
This timeline shows a graph from 1972 to 2016 of Argentina. No data until 1971. Number of actual observations by date: 38.
Source name:
World Development Indicators
Source organization:
World Bank national accounts data, and OECD National Accounts data files.
Categories, topics:
Economy & Growth
Last updated:
apr 23, 2017
Indicators value changes by year
Minimum:
11.044 bln
jan 1, 1972
Maximum:
382.938 bln
jan 1, 2016
At the date of observation
Value
Absolute change
Change from previous value
jan 1, 1972
11.044 bln
+11.044 bln
0.0%
jan 1, 1973
18.449 bln
+7.406 bln
67.06%
jan 1, 1974
31.052 bln
+12.603 bln
68.31%
jan 1, 1975
41.706 bln
+10.654 bln
34.31%
jan 1, 1976
28.194 bln
-13.512 bln
-32.4%
jan 1, 1977
28.96 bln
+766.509 mln
2.72%
jan 1, 1978
32.793 bln
+3.833 bln
13.23%
jan 1, 1979
33.77 bln
+976.854 mln
2.98%
jan 1, 1980
43.597 bln
+9.827 bln
29.1%
jan 1, 1988
83.811 bln
+40.214 bln
92.24%
jan 1, 1989
93.037 bln
+9.227 bln
11.01%
jan 1, 1990
56.337 bln
-36.7 bln
-39.45%
jan 1, 1991
109.038 bln
+52.701 bln
93.55%
jan 1, 1992
152.619 bln
+43.58 bln
39.97%
jan 1, 1993
187.279 bln
+34.66 bln
22.71%
jan 1, 1994
165.335 bln
-21.944 bln
-11.72%
jan 1, 1995
180.076 bln
+14.741 bln
8.92%
jan 1, 1996
178.36 bln
-1.716 bln
-0.95%
jan 1, 1997
190.683 bln
+12.323 bln
6.91%
jan 1, 1998
207.292 bln
+16.61 bln
8.71%
jan 1, 1999
209.53 bln
+2.238 bln
1.08%
jan 1, 2000
198.441 bln
-11.089 bln
-5.29%
jan 1, 2001
200.855 bln
+2.414 bln
1.22%
jan 1, 2002
189.052 bln
-11.803 bln
-5.88%
jan 1, 2003
59.408 bln
-129.644 bln
-68.58%
jan 1, 2004
79.368 bln
+19.96 bln
33.6%
jan 1, 2005
105.927 bln
+26.559 bln
33.46%
jan 1, 2006
125.96 bln
+20.033 bln
18.91%
jan 1, 2007
146.606 bln
+20.645 bln
16.39%
jan 1, 2008
179.159 bln
+32.554 bln
22.21%
jan 1, 2009
225.8 bln
+46.64 bln
26.03%
jan 1, 2010
210.635 bln
-15.164 bln
-6.72%
jan 1, 2011
271.315 bln
+60.679 bln
28.81%
jan 1, 2012
338.182 bln
+66.867 bln
24.65%
jan 1, 2013
350.173 bln
+11.991 bln
3.55%
jan 1, 2014
361.03 bln
+10.857 bln
3.1%
jan 1, 2015
340.089 bln
-20.941 bln
-5.8%
jan 1, 2016
382.938 bln
+42.849 bln
12.6%
Ranking of countries by current statistics by years


Comments: