29
/
en
AIzaSyAYiBZKx7MnpbEhh9jyipgxe19OcubqV5w
April 1, 2024
177762
Lesotho
LSO
true
2
1
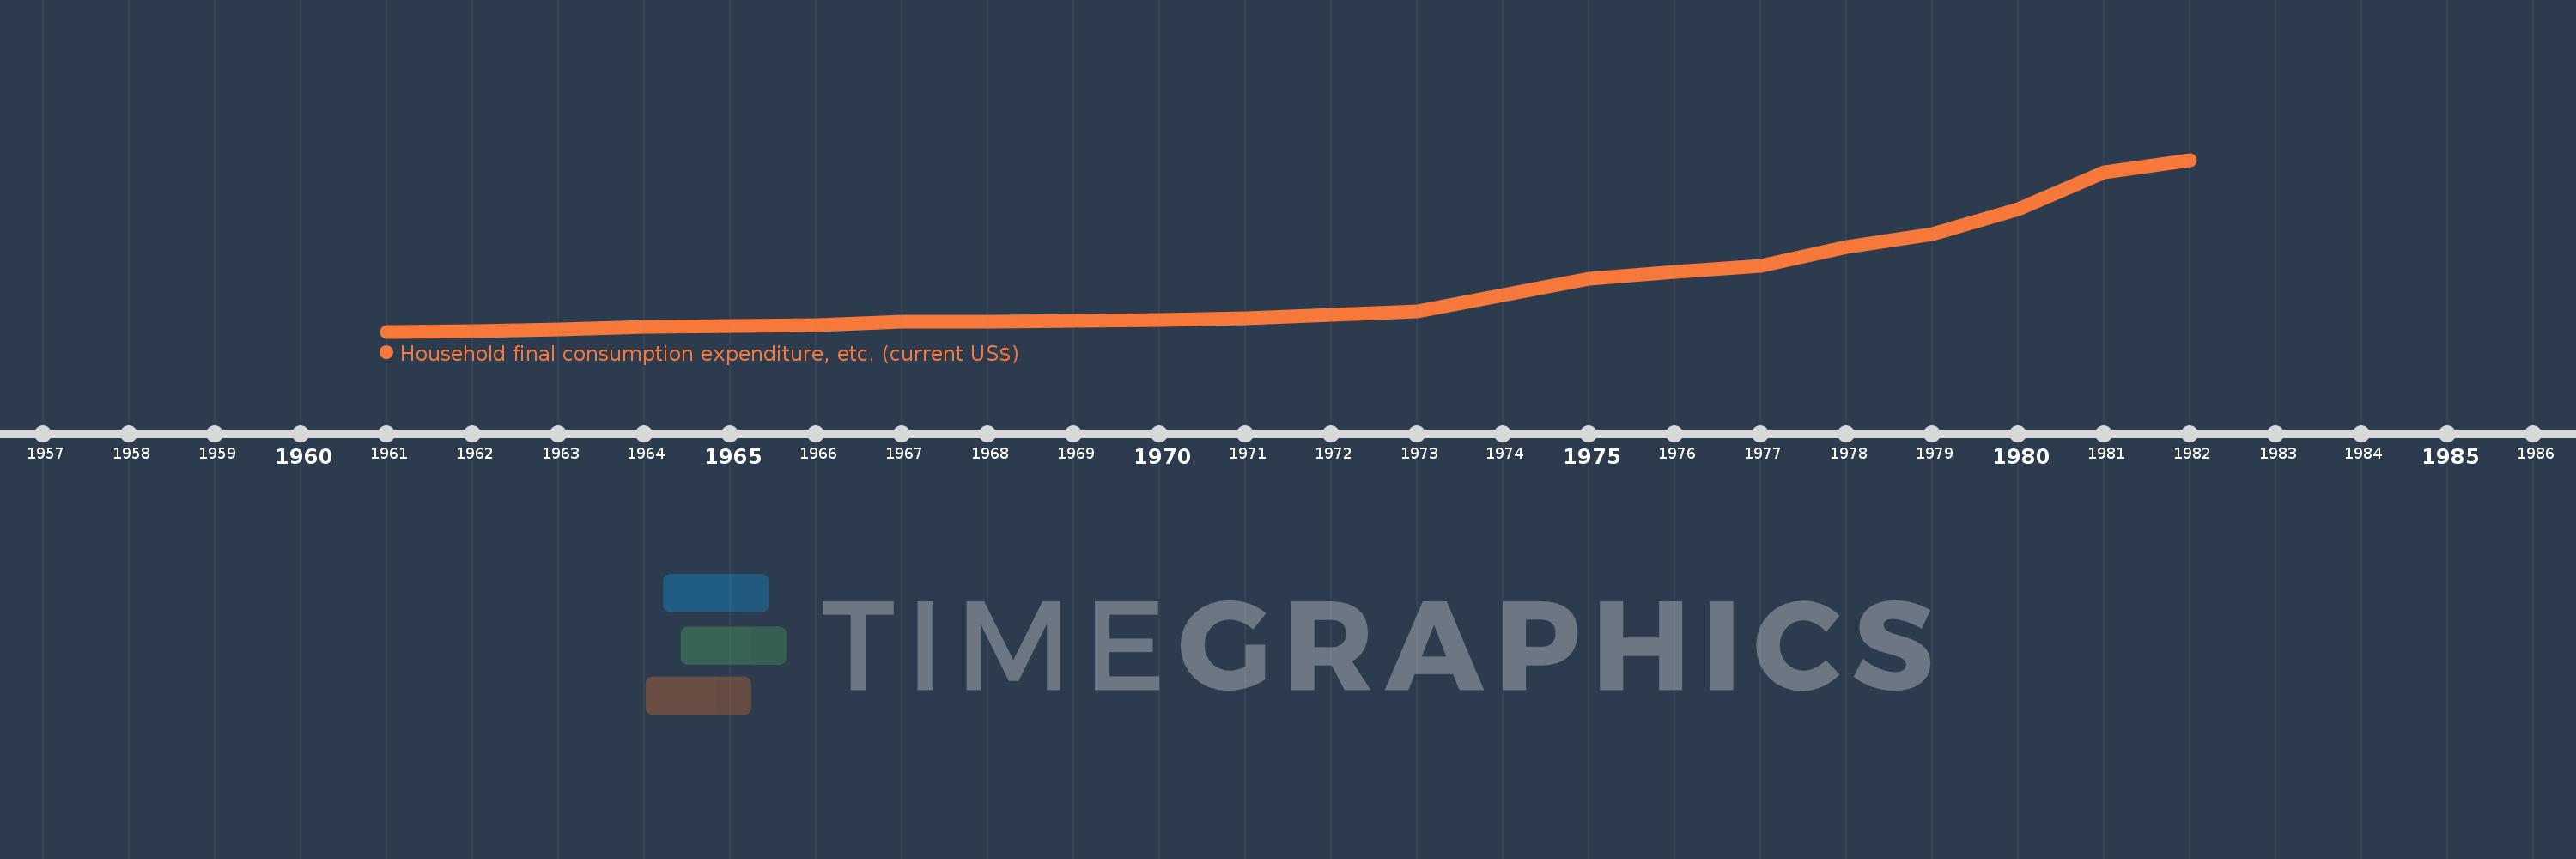
Household final consumption expenditure, etc. (current US$)
1982,1981,1980,1979,1978,1977,1976,1975,1974,1973,1972,1971,1970,1969,1968,1967,1966,1965,1964,1963,1962,1961
This statistics in other country:
AfghanistanAlbaniaAlgeriaAngolaAntigua and BarbudaArab WorldArgentinaArmeniaArubaAustraliaAustriaAzerbaijanBahamas, TheBahrainBangladeshBarbadosBelarusBelgiumBelizeBeninBermudaBhutanBoliviaBosnia and HerzegovinaBotswanaBrazilBrunei DarussalamBulgariaBurkina FasoBurundiCabo VerdeCambodiaCameroonCanadaCaribbean small statesCentral African RepublicCentral Europe and the BalticsChadChileChinaColombiaComorosCongo, Dem. Rep.Congo, Rep.Costa RicaCote d'IvoireCroatiaCubaCyprusCzech RepublicDenmarkDjiboutiDominicaDominican RepublicEarly-demographic dividendEast Asia & PacificEast Asia & Pacific (excluding high income)East Asia & Pacific (IDA & IBRD countries)EcuadorEgypt, Arab Rep.El SalvadorEquatorial GuineaEritreaEstoniaEthiopiaEuro areaEurope & Central AsiaEurope & Central Asia (excluding high income)Europe & Central Asia (IDA & IBRD countries)European UnionFaroe IslandsFijiFinlandFragile and conflict affected situationsFranceGabonGambia, TheGeorgiaGermanyGhanaGreeceGrenadaGuatemalaGuineaGuinea-BissauGuyanaHaitiHeavily indebted poor countries (HIPC)High incomeHondurasHong Kong SAR, ChinaHungaryIBRD onlyIcelandIDA & IBRD totalIDA blendIDA onlyIDA totalIndiaIndonesiaIran, Islamic Rep.IraqIrelandIsraelItalyJamaicaJapanJordanKazakhstanKenyaKiribatiKorea, Rep.KosovoKuwaitKyrgyz RepublicLao PDRLate-demographic dividendLatin America & Caribbean Latin America & Caribbean (excluding high income)Latin America & the Caribbean (IDA & IBRD countries)LatviaLeast developed countries: UN classificationLebanonLesothoLiberiaLibyaLithuaniaLow & middle incomeLow incomeLower middle incomeLuxembourgMacao SAR, ChinaMacedonia, FYRMadagascarMalawiMalaysiaMaldivesMaliMaltaMauritaniaMauritiusMexicoMicronesia, Fed. Sts.Middle East & North AfricaMiddle East & North Africa (excluding high income)Middle East & North Africa (IDA & IBRD countries)Middle incomeMoldovaMongoliaMontenegroMoroccoMozambiqueNamibiaNepalNetherlandsNew CaledoniaNew ZealandNicaraguaNigerNigeriaNorth AmericaNorwayOECD membersOmanOther small statesPakistanPanamaPapua New GuineaParaguayPeruPhilippinesPolandPortugalPost-demographic dividendPre-demographic dividendPuerto RicoQatarRomaniaRussian FederationRwandaSaudi ArabiaSenegalSerbiaSeychellesSierra LeoneSingaporeSlovak RepublicSloveniaSmall statesSolomon IslandsSouth AfricaSouth AsiaSouth Asia (IDA & IBRD)South SudanSpainSri LankaSt. Kitts and NevisSt. LuciaSt. Vincent and the GrenadinesSub-Saharan Africa Sub-Saharan Africa (excluding high income)Sub-Saharan Africa (IDA & IBRD countries)SudanSurinameSwazilandSwedenSwitzerlandSyrian Arab RepublicTajikistanTanzaniaThailandTimor-LesteTogoTongaTrinidad and TobagoTunisiaTurkeyTurkmenistanUgandaUkraineUnited Arab EmiratesUnited KingdomUnited StatesUpper middle incomeUruguayUzbekistanVanuatuVenezuela, RBVietnamWest Bank and GazaWorldYemen, Rep.ZambiaZimbabwe Timeline:
This timeline shows a graph from 1961 to 1982 of Lesotho. No data until 1960. Number of actual observations by date: 22.
Source name:
World Development Indicators
Source organization:
World Bank national accounts data, and OECD National Accounts data files.
Categories, topics:
Economy & Growth
Last updated:
apr 23, 2017
Indicators value changes by year
Minimum:
37.379 mln
jan 1, 1961
Maximum:
604.465 mln
jan 1, 1982
At the date of observation
Value
Absolute change
Change from previous value
jan 1, 1961
37.379 mln
+37.379 mln
0.0%
jan 1, 1962
38.499 mln
+1.12 mln
3.0%
jan 1, 1963
44.939 mln
+6.44 mln
16.73%
jan 1, 1964
51.939 mln
+7.0 mln
15.58%
jan 1, 1965
56.699 mln
+4.76 mln
9.16%
jan 1, 1966
59.639 mln
+2.94 mln
5.19%
jan 1, 1967
69.719 mln
+10.08 mln
16.9%
jan 1, 1968
69.341 mln
-377.992K
-0.54%
jan 1, 1969
71.665 mln
+2.324 mln
3.35%
jan 1, 1970
74.787 mln
+3.122 mln
4.36%
jan 1, 1971
81.338 mln
+6.552 mln
8.76%
jan 1, 1972
93.261 mln
+11.922 mln
14.66%
jan 1, 1973
104.332 mln
+11.071 mln
11.87%
jan 1, 1974
157.205 mln
+52.873 mln
50.68%
jan 1, 1975
211.185 mln
+53.98 mln
34.34%
jan 1, 1976
234.753 mln
+23.569 mln
11.16%
jan 1, 1977
253.45 mln
+18.697 mln
7.96%
jan 1, 1978
316.352 mln
+62.902 mln
24.82%
jan 1, 1979
359.706 mln
+43.353 mln
13.7%
jan 1, 1980
442.162 mln
+82.456 mln
22.92%
jan 1, 1981
562.105 mln
+119.943 mln
27.13%
jan 1, 1982
604.465 mln
+42.36 mln
7.54%
Ranking of countries by current statistics by years


Comments: