29
/
en
AIzaSyAYiBZKx7MnpbEhh9jyipgxe19OcubqV5w
April 1, 2024
280776
Venezuela, RB
VEN
true
2
1
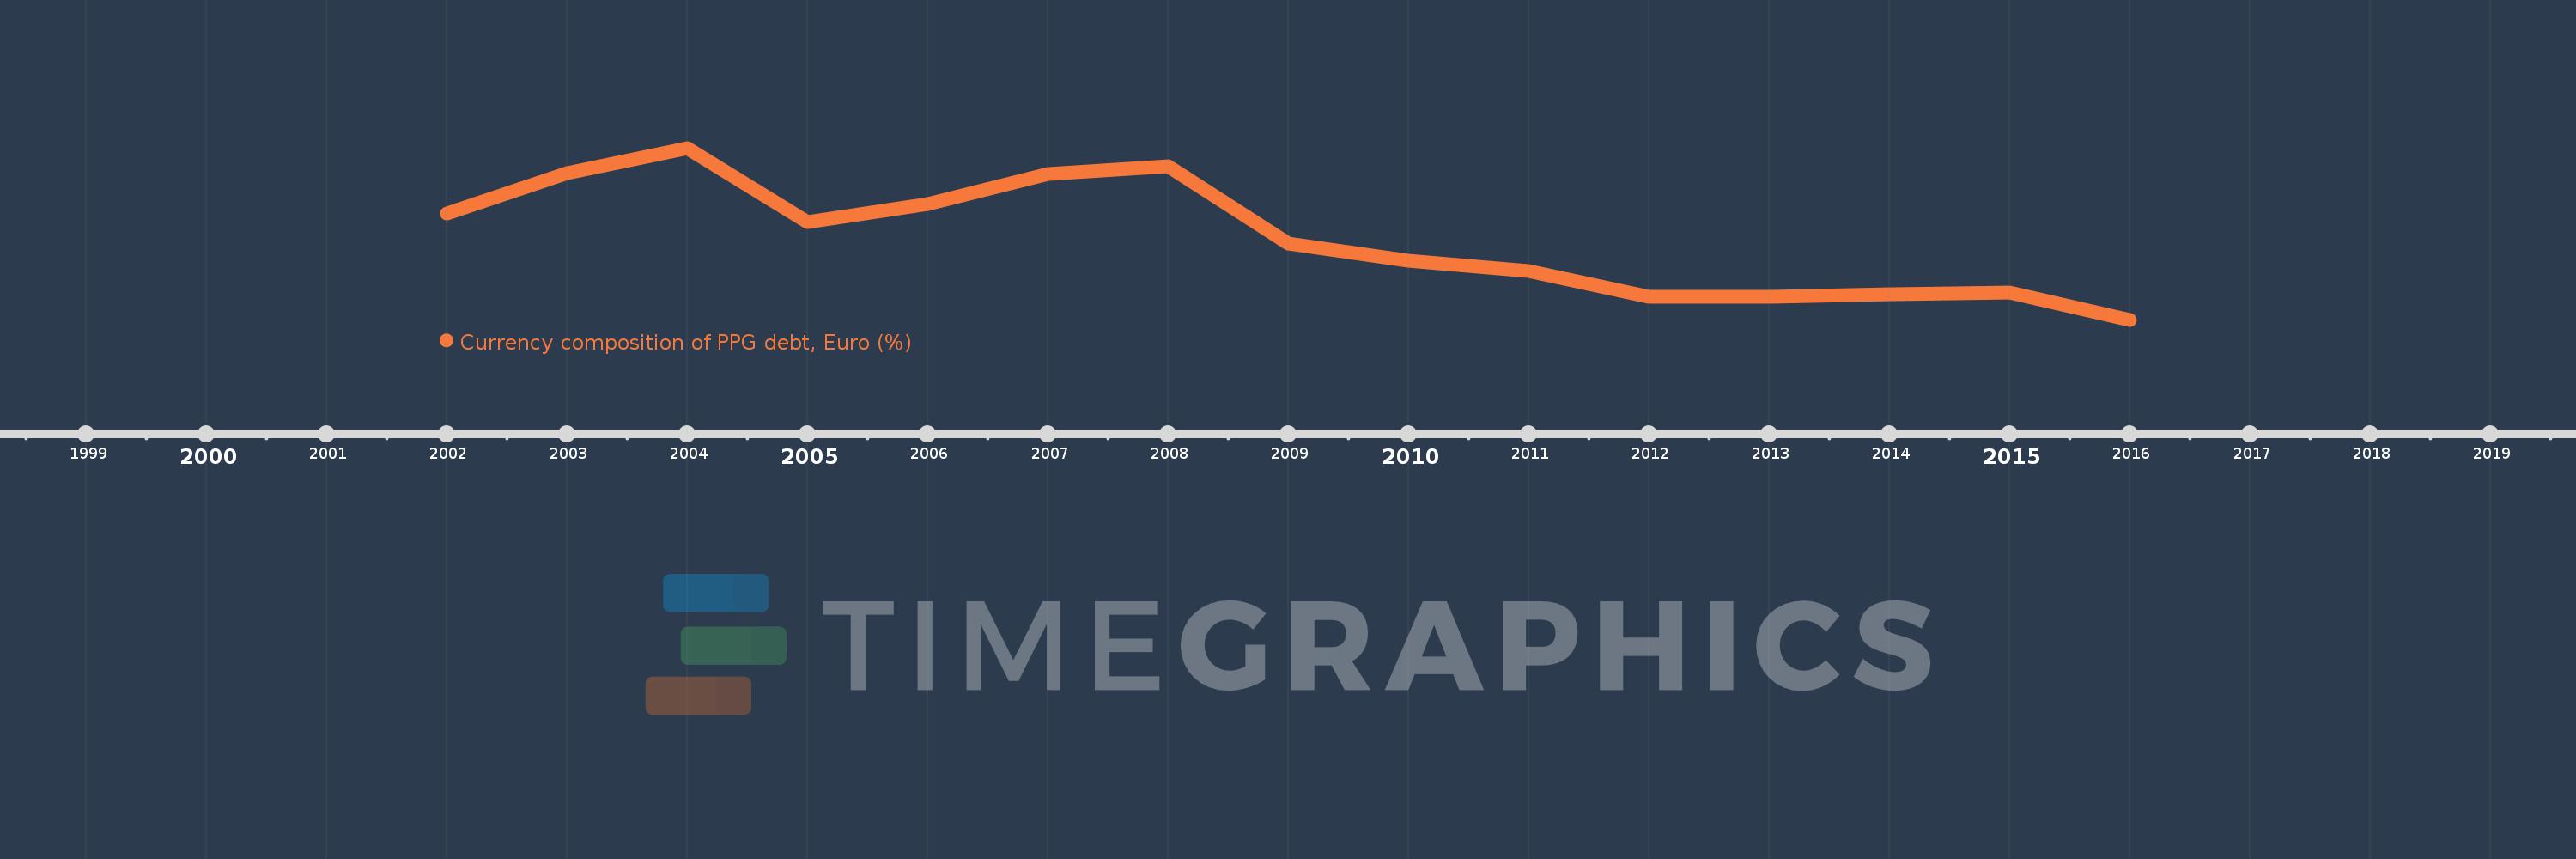
Currency composition of PPG debt, Euro (%)
2016,2015,2014,2013,2012,2011,2010,2009,2008,2007,2006,2005,2004,2003,2002
This statistics in other country:
Timeline:
This timeline shows a graph from 2002 to 2016 of Venezuela, RB. No data until 2001. Number of actual observations by date: 15.
Source name:
World Development Indicators
Source organization:
World Bank, International Debt Statistics.
Categories, topics:
External Debt
Last updated:
apr 23, 2017
Indicators value changes by year
Maximum:
16.309
jan 1, 2004
At the date of observation
Value
Absolute change
Change from previous value
jan 1, 2002
10.765
+10.765
0.0%
jan 1, 2003
14.132
+3.367
31.27%
jan 1, 2004
16.309
+2.177
15.41%
jan 1, 2005
10.004
-6.305
-38.66%
jan 1, 2006
11.511
+1.507
15.06%
jan 1, 2007
14.085
+2.574
22.36%
jan 1, 2008
14.752
+0.667
4.73%
jan 1, 2009
8.203
-6.548
-44.39%
jan 1, 2010
6.721
-1.482
-18.07%
jan 1, 2011
5.845
-0.876
-13.04%
jan 1, 2012
3.637
-2.208
-37.77%
jan 1, 2013
3.644
+0.007
0.2%
jan 1, 2014
3.891
+0.246
6.76%
jan 1, 2015
3.979
+0.088
2.26%
jan 1, 2016
1.697
-2.282
-57.35%
Ranking of countries by current statistics by years


Comments: