29
/
en
AIzaSyAYiBZKx7MnpbEhh9jyipgxe19OcubqV5w
April 1, 2024
85756
Bhutan
BTN
true
2
1
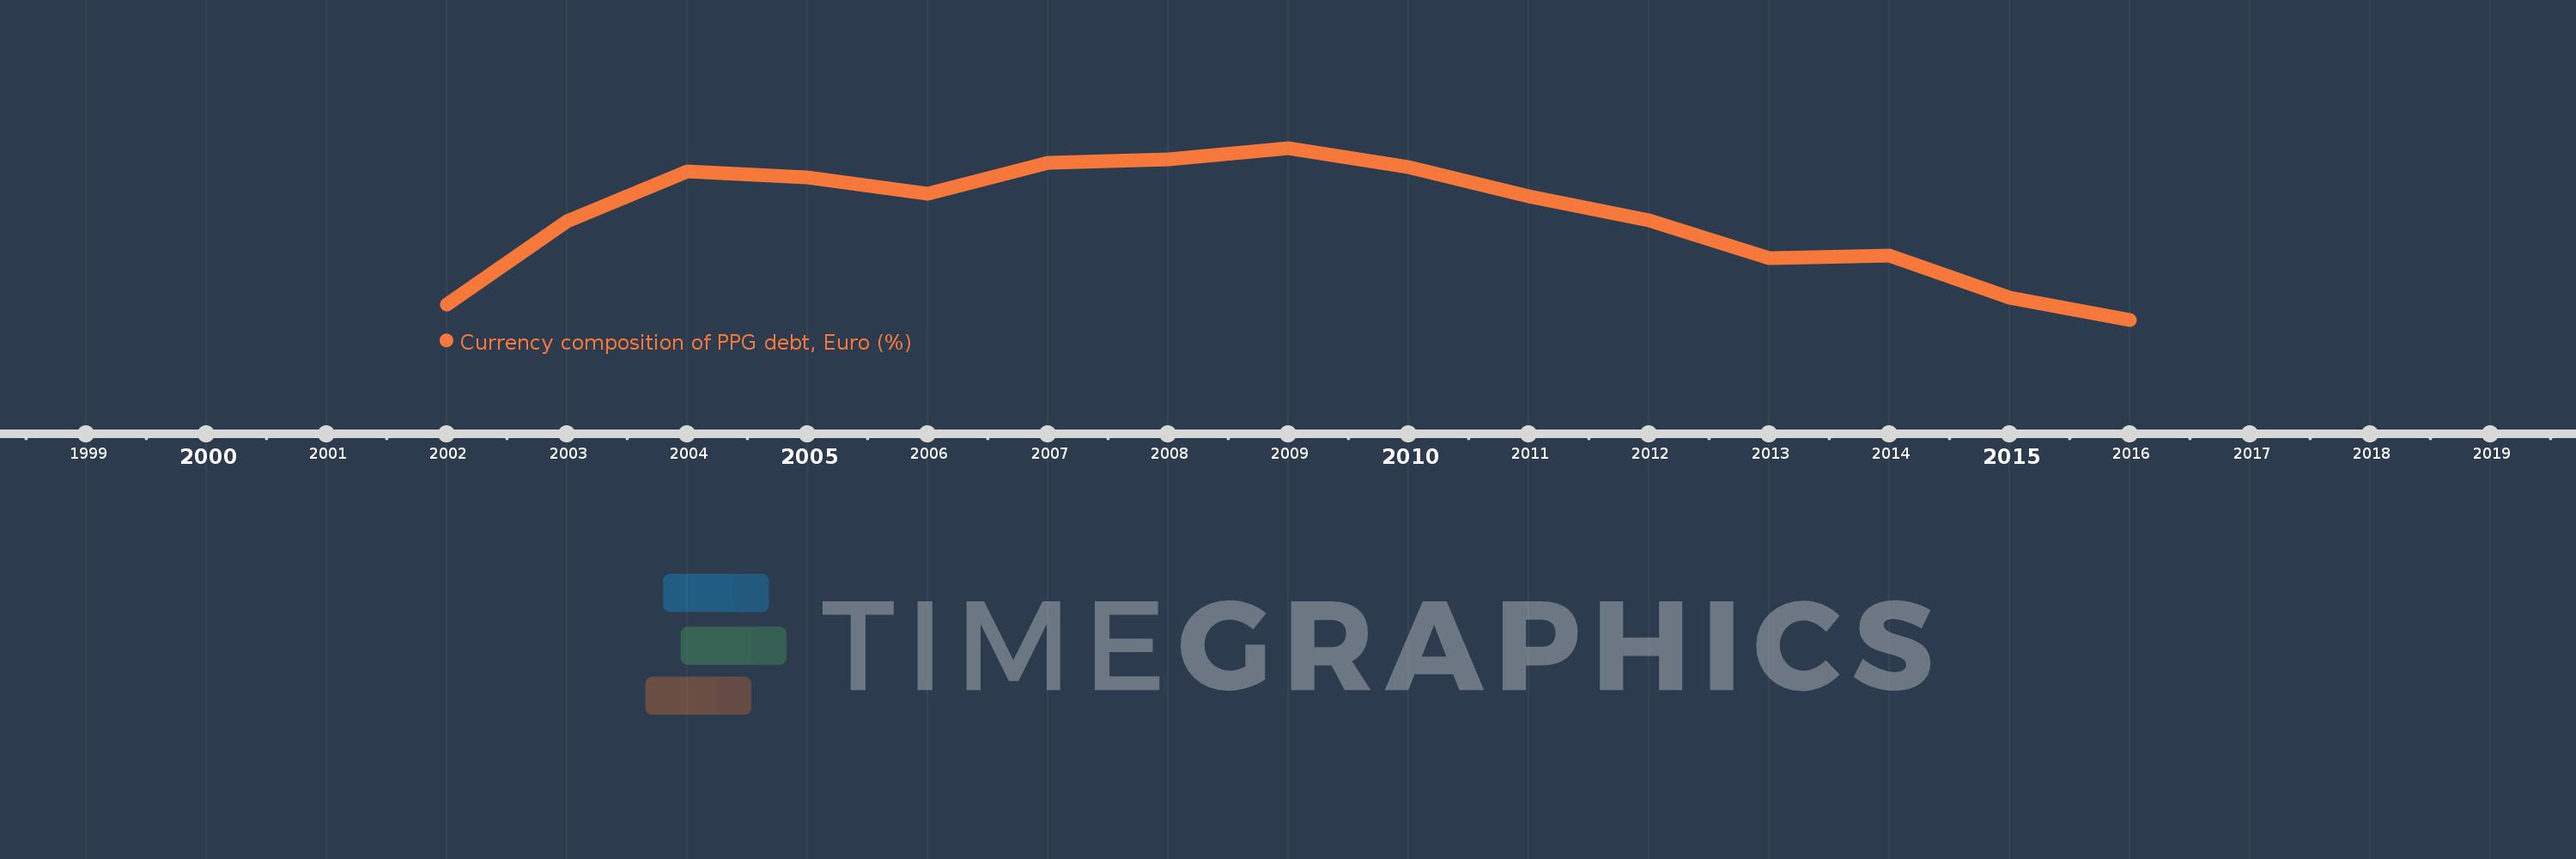
Currency composition of PPG debt, Euro (%)
2016,2015,2014,2013,2012,2011,2010,2009,2008,2007,2006,2005,2004,2003,2002
This statistics in other country:
Timeline:
This timeline shows a graph from 2002 to 2016 of Bhutan. No data until 2001. Number of actual observations by date: 15.
Source name:
World Development Indicators
Source organization:
World Bank, International Debt Statistics.
Categories, topics:
External Debt
Last updated:
apr 23, 2017
Indicators value changes by year
Maximum:
11.579
jan 1, 2009
At the date of observation
Value
Absolute change
Change from previous value
jan 1, 2002
4.896
+4.896
0.0%
jan 1, 2003
8.451
+3.555
72.61%
jan 1, 2004
10.586
+2.135
25.27%
jan 1, 2005
10.334
-0.252
-2.38%
jan 1, 2006
9.621
-0.713
-6.9%
jan 1, 2007
10.93
+1.308
13.6%
jan 1, 2008
11.099
+0.169
1.55%
jan 1, 2009
11.579
+0.48
4.33%
jan 1, 2010
10.745
-0.834
-7.2%
jan 1, 2011
9.513
-1.232
-11.47%
jan 1, 2012
8.504
-1.009
-10.61%
jan 1, 2013
6.89
-1.614
-18.98%
jan 1, 2014
6.978
+0.088
1.27%
jan 1, 2015
5.204
-1.774
-25.42%
jan 1, 2016
4.261
-0.943
-18.12%
Ranking of countries by current statistics by years


Comments: