29
/
en
AIzaSyAYiBZKx7MnpbEhh9jyipgxe19OcubqV5w
April 1, 2024
124624
Egypt, Arab Rep.
EGY
true
2
1
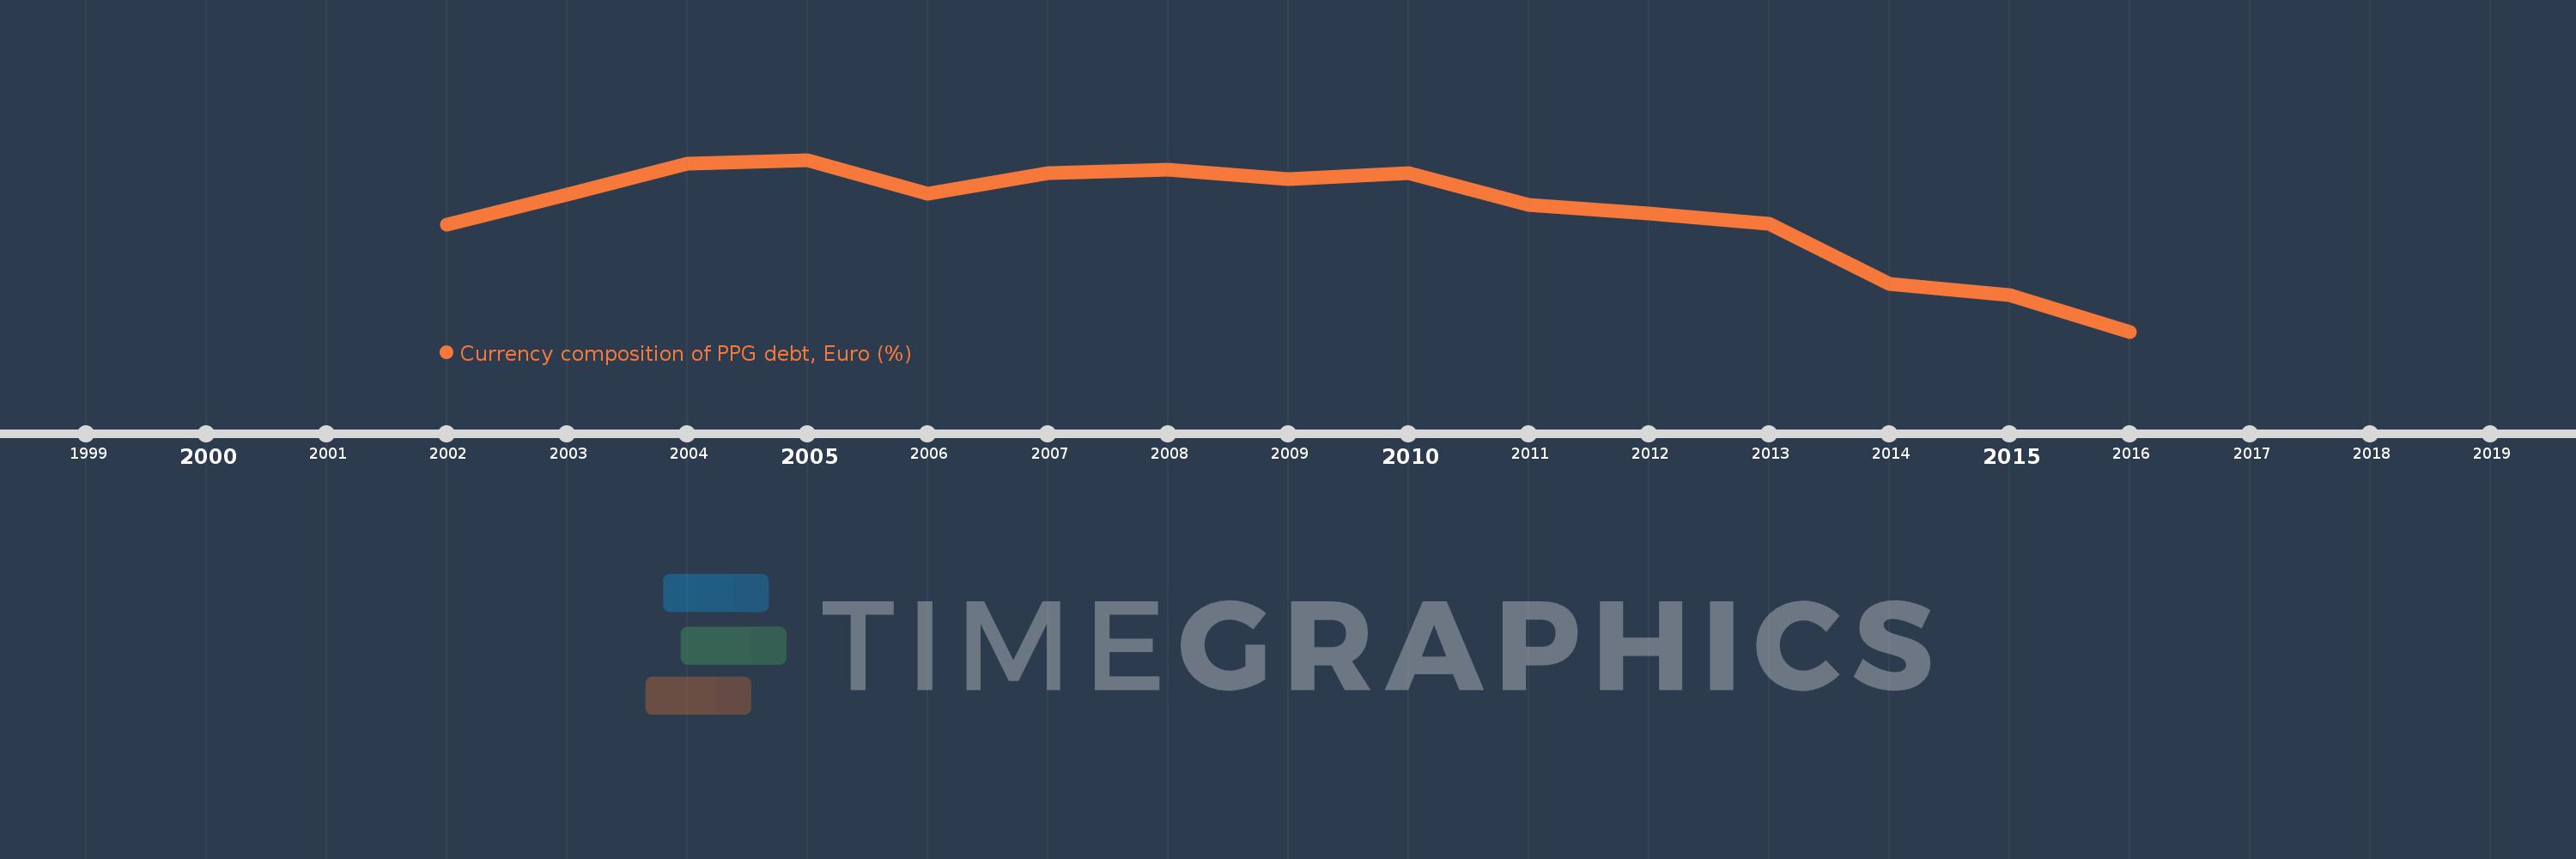
Currency composition of PPG debt, Euro (%)
2016,2015,2014,2013,2012,2011,2010,2009,2008,2007,2006,2005,2004,2003,2002
This statistics in other country:
Timeline:
This timeline shows a graph from 2002 to 2016 of Egypt, Arab Rep.. No data until 2001. Number of actual observations by date: 15.
Source name:
World Development Indicators
Source organization:
World Bank, International Debt Statistics.
Categories, topics:
External Debt
Last updated:
apr 23, 2017
Indicators value changes by year
Minimum:
15.714
jan 1, 2016
Maximum:
37.202
jan 1, 2005
At the date of observation
Value
Absolute change
Change from previous value
jan 1, 2002
29.046
+29.046
0.0%
jan 1, 2003
32.821
+3.775
13.0%
jan 1, 2004
36.7
+3.879
11.82%
jan 1, 2005
37.202
+0.502
1.37%
jan 1, 2006
32.923
-4.279
-11.5%
jan 1, 2007
35.569
+2.646
8.04%
jan 1, 2008
35.964
+0.395
1.11%
jan 1, 2009
34.77
-1.193
-3.32%
jan 1, 2010
35.534
+0.764
2.2%
jan 1, 2011
31.585
-3.949
-11.11%
jan 1, 2012
30.485
-1.099
-3.48%
jan 1, 2013
29.199
-1.286
-4.22%
jan 1, 2014
21.632
-7.568
-25.92%
jan 1, 2015
20.309
-1.322
-6.11%
jan 1, 2016
15.714
-4.595
-22.63%
Ranking of countries by current statistics by years


Comments: