29
/
en
AIzaSyAYiBZKx7MnpbEhh9jyipgxe19OcubqV5w
April 1, 2024
162366
Jamaica
JAM
true
2
1
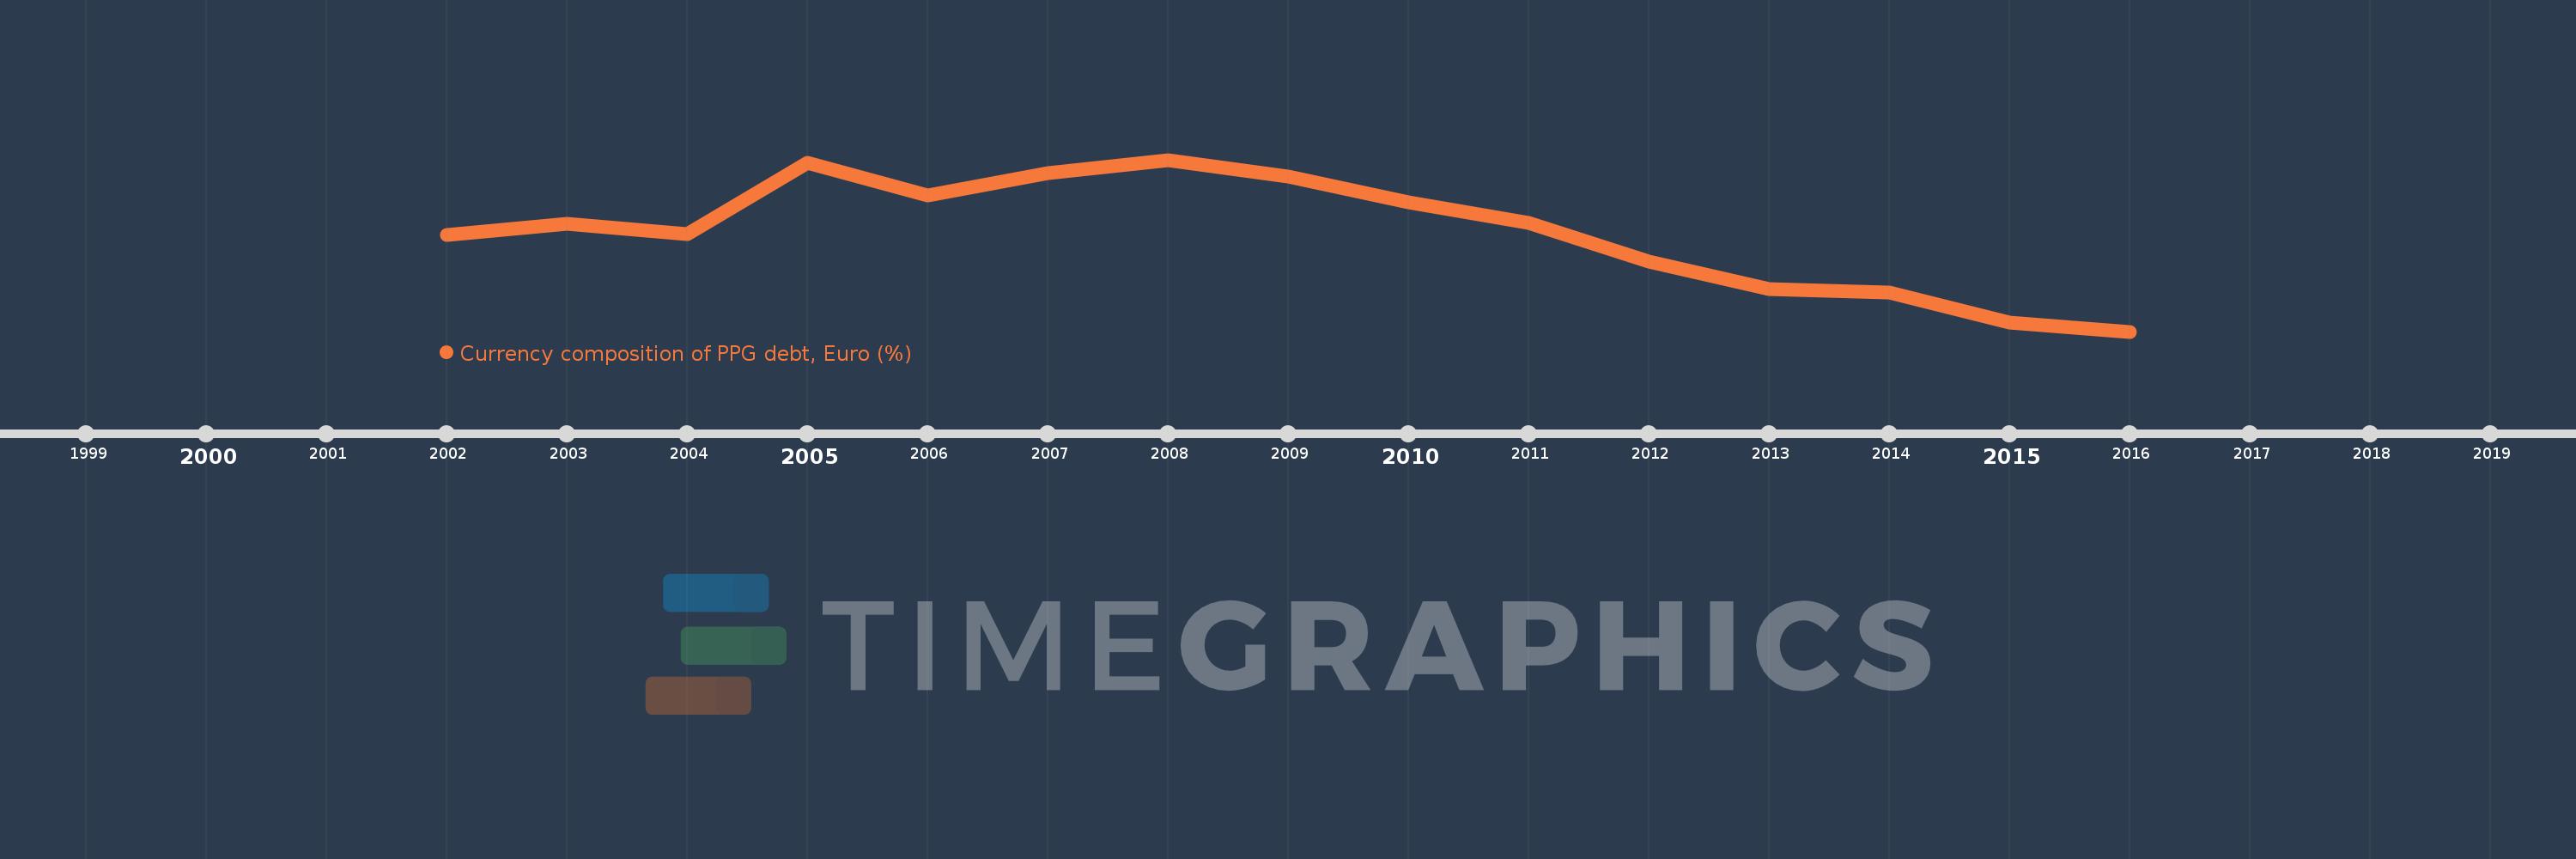
Currency composition of PPG debt, Euro (%)
2016,2015,2014,2013,2012,2011,2010,2009,2008,2007,2006,2005,2004,2003,2002
This statistics in other country:
Timeline:
This timeline shows a graph from 2002 to 2016 of Jamaica. No data until 2001. Number of actual observations by date: 15.
Source name:
World Development Indicators
Source organization:
World Bank, International Debt Statistics.
Categories, topics:
External Debt
Last updated:
apr 23, 2017
Indicators value changes by year
Maximum:
22.282
jan 1, 2008
At the date of observation
Value
Absolute change
Change from previous value
jan 1, 2002
13.517
+13.517
0.0%
jan 1, 2003
14.798
+1.281
9.48%
jan 1, 2004
13.643
-1.154
-7.8%
jan 1, 2005
21.938
+8.295
60.8%
jan 1, 2006
18.127
-3.811
-17.37%
jan 1, 2007
20.711
+2.583
14.25%
jan 1, 2008
22.282
+1.571
7.59%
jan 1, 2009
20.322
-1.96
-8.8%
jan 1, 2010
17.338
-2.983
-14.68%
jan 1, 2011
14.873
-2.466
-14.22%
jan 1, 2012
10.375
-4.497
-30.24%
jan 1, 2013
7.182
-3.193
-30.78%
jan 1, 2014
6.765
-0.417
-5.81%
jan 1, 2015
3.211
-3.554
-52.54%
jan 1, 2016
2.202
-1.008
-31.41%
Ranking of countries by current statistics by years


Comments: