29
/
en
AIzaSyAYiBZKx7MnpbEhh9jyipgxe19OcubqV5w
April 1, 2024
157096
Iran, Islamic Rep.
IRN
true
2
1
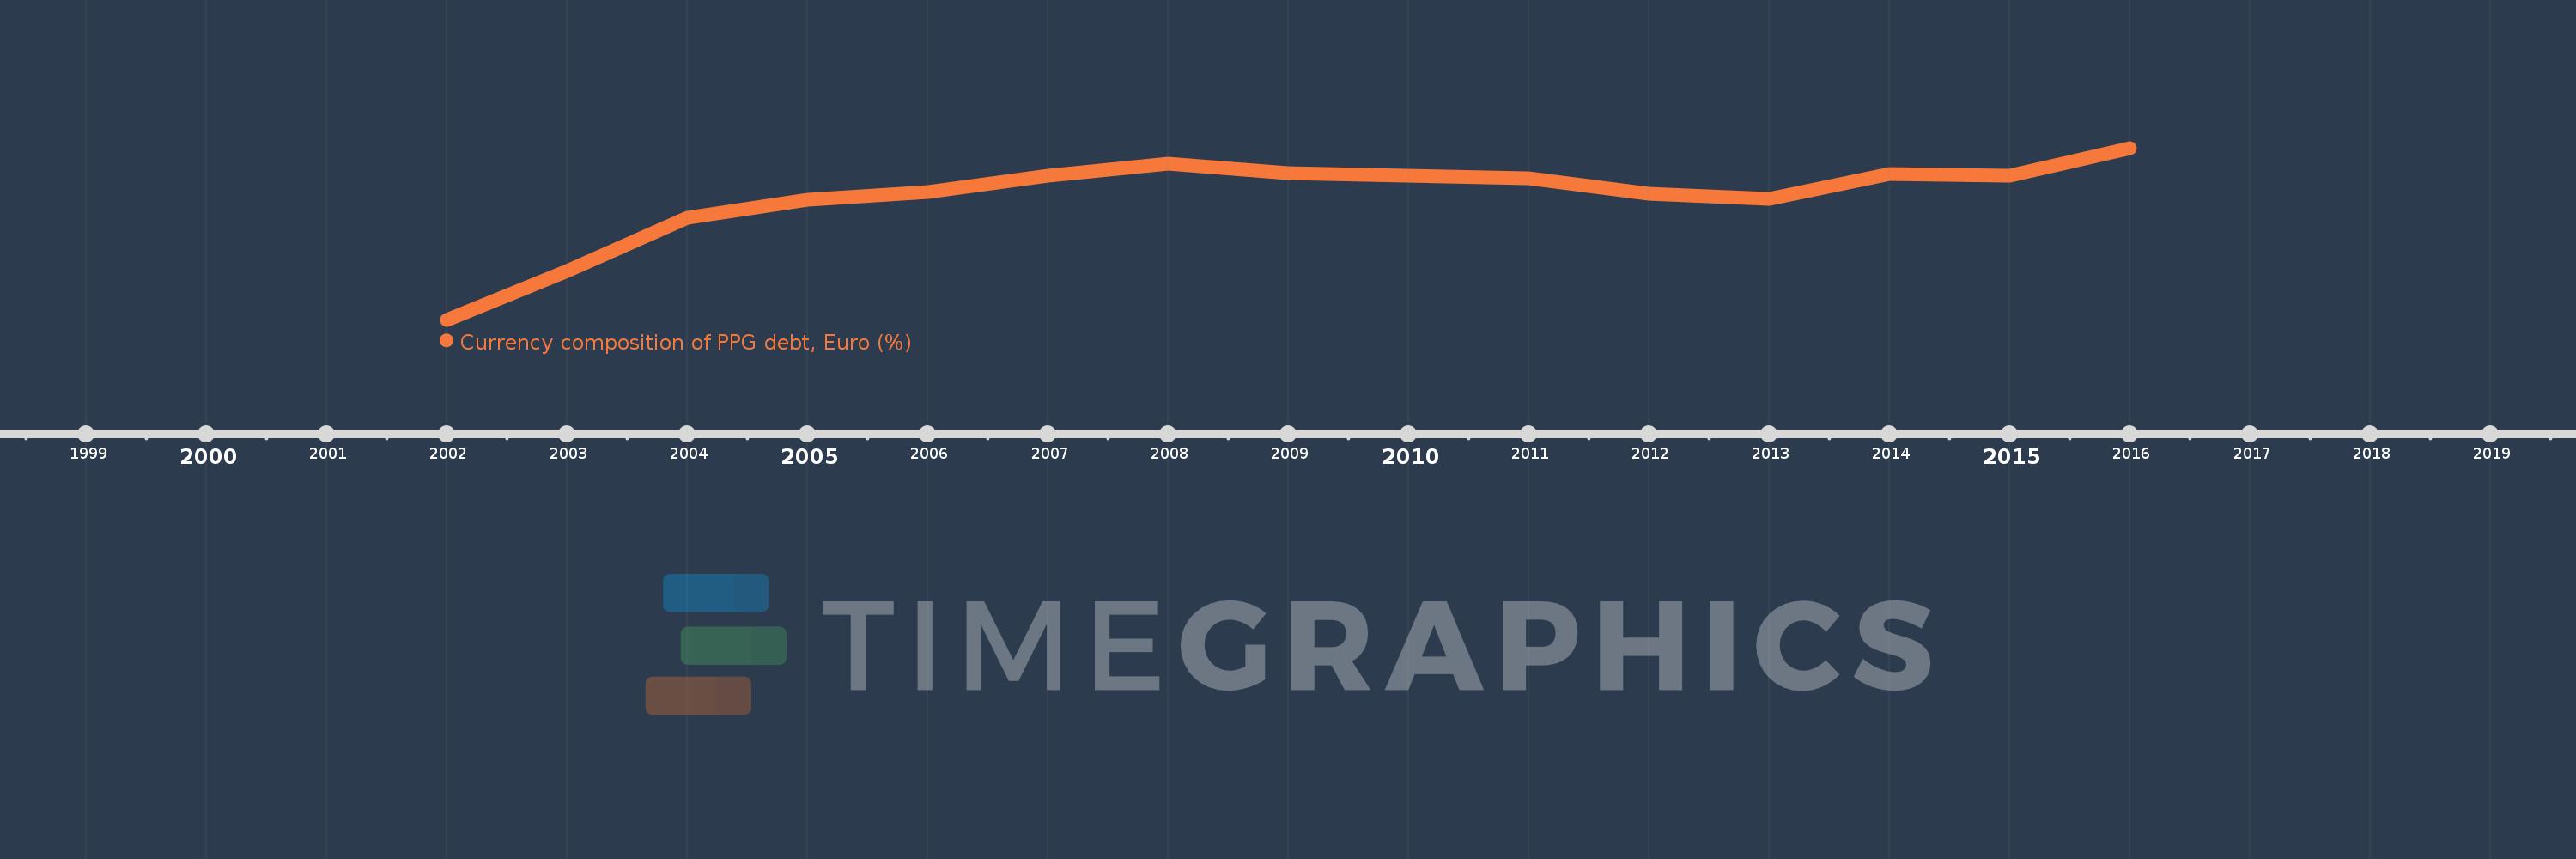
Currency composition of PPG debt, Euro (%)
2016,2015,2014,2013,2012,2011,2010,2009,2008,2007,2006,2005,2004,2003,2002
This statistics in other country:
Timeline:
This timeline shows a graph from 2002 to 2016 of Iran, Islamic Rep.. No data until 2001. Number of actual observations by date: 15.
Source name:
World Development Indicators
Source organization:
World Bank, International Debt Statistics.
Categories, topics:
External Debt
Last updated:
apr 23, 2017
Indicators value changes by year
Minimum:
23.898
jan 1, 2002
Maximum:
62.092
jan 1, 2016
At the date of observation
Value
Absolute change
Change from previous value
jan 1, 2002
23.898
+23.898
0.0%
jan 1, 2003
34.752
+10.854
45.42%
jan 1, 2004
46.655
+11.904
34.25%
jan 1, 2005
50.529
+3.874
8.3%
jan 1, 2006
52.258
+1.729
3.42%
jan 1, 2007
55.833
+3.575
6.84%
jan 1, 2008
58.669
+2.836
5.08%
jan 1, 2009
56.53
-2.139
-3.65%
jan 1, 2010
56.014
-0.516
-0.91%
jan 1, 2011
55.354
-0.66
-1.18%
jan 1, 2012
51.828
-3.526
-6.37%
jan 1, 2013
50.837
-0.991
-1.91%
jan 1, 2014
56.272
+5.435
10.69%
jan 1, 2015
55.832
-0.44
-0.78%
jan 1, 2016
62.092
+6.26
11.21%
Ranking of countries by current statistics by years


Comments: