29
/
en
AIzaSyAYiBZKx7MnpbEhh9jyipgxe19OcubqV5w
April 1, 2024
142849
Grenada
GRD
true
2
1
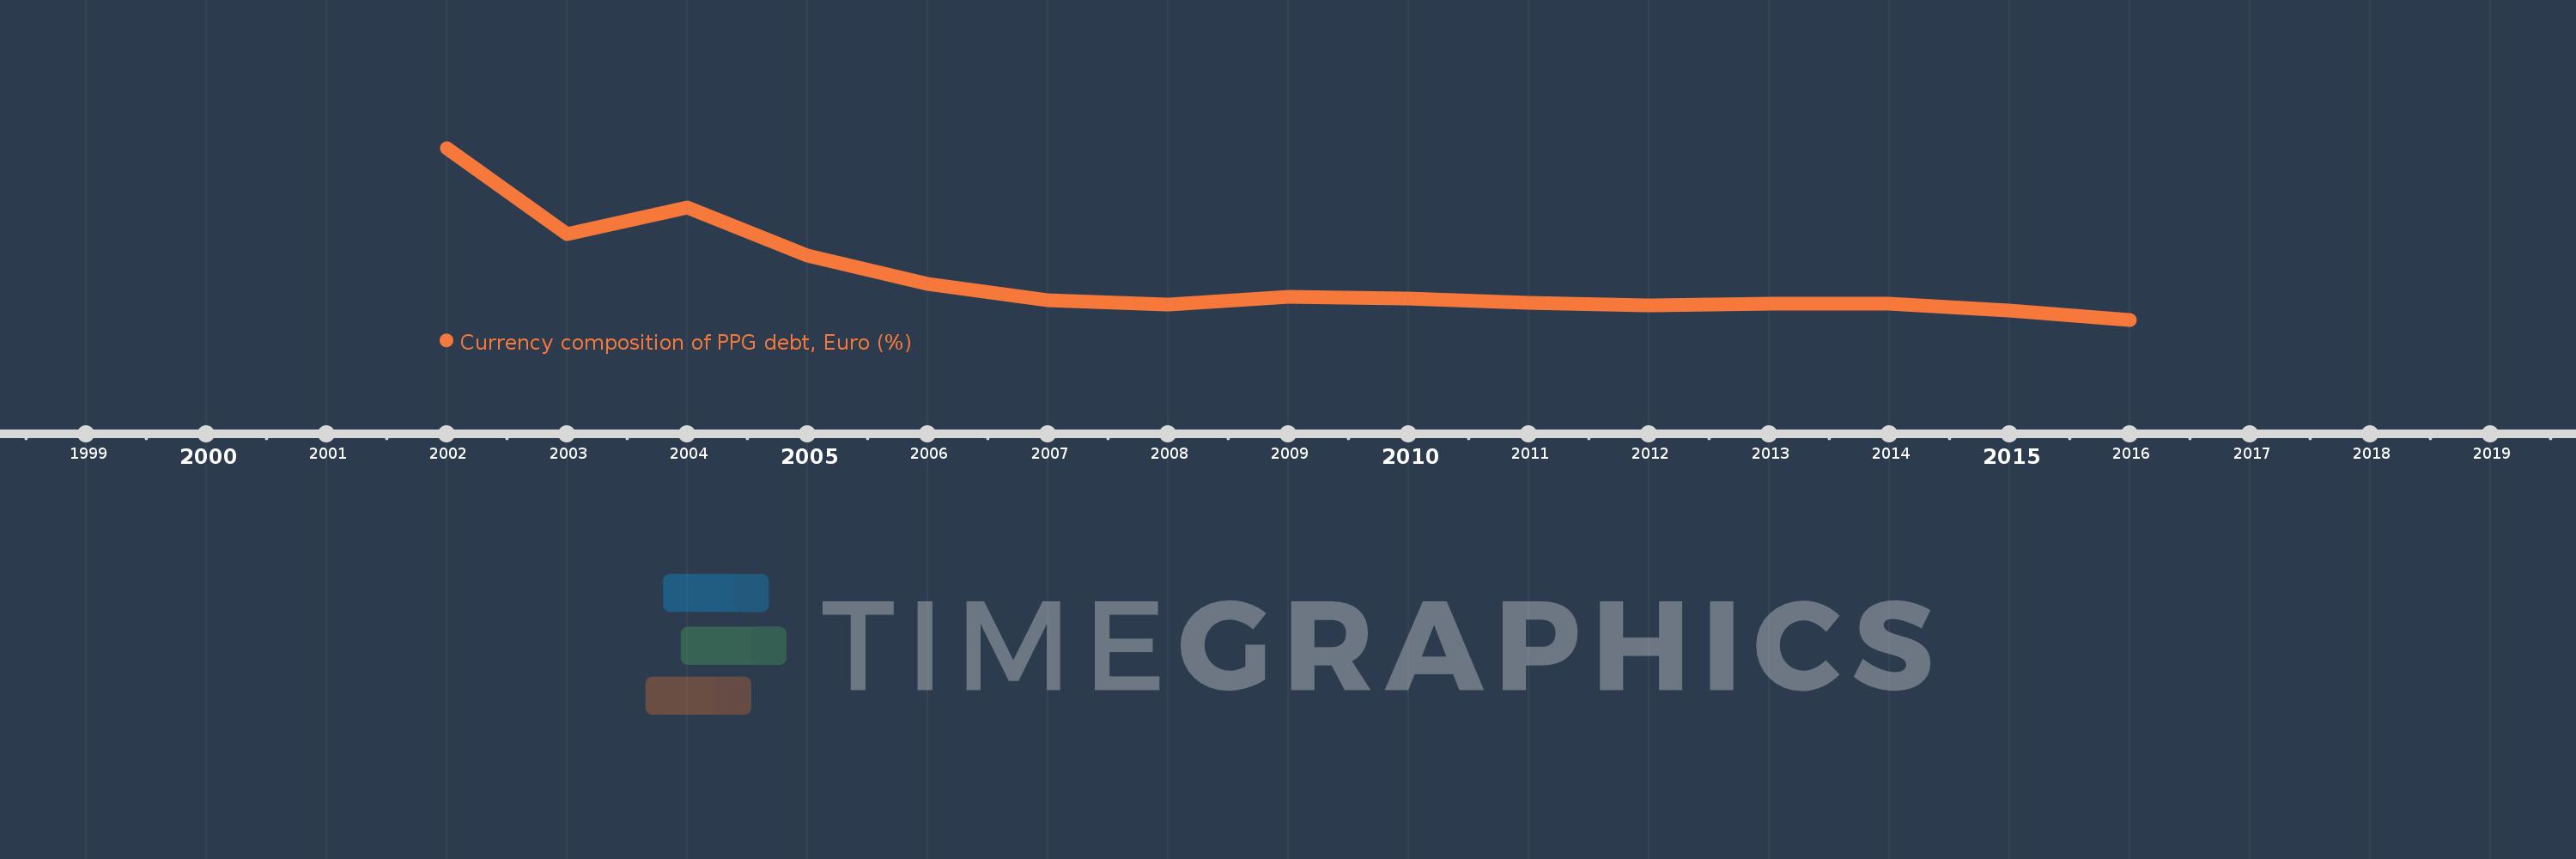
Currency composition of PPG debt, Euro (%)
2016,2015,2014,2013,2012,2011,2010,2009,2008,2007,2006,2005,2004,2003,2002
This statistics in other country:
Timeline:
This timeline shows a graph from 2002 to 2016 of Grenada. No data until 2001. Number of actual observations by date: 15.
Source name:
World Development Indicators
Source organization:
World Bank, International Debt Statistics.
Categories, topics:
External Debt
Last updated:
apr 23, 2017
Indicators value changes by year
At the date of observation
Value
Absolute change
Change from previous value
jan 1, 2002
1.423
+1.423
0.0%
jan 1, 2003
0.777
-0.646
-45.38%
jan 1, 2004
0.98
+0.202
25.99%
jan 1, 2005
0.617
-0.363
-37.0%
jan 1, 2006
0.407
-0.21
-33.97%
jan 1, 2007
0.285
-0.122
-30.04%
jan 1, 2008
0.252
-0.034
-11.75%
jan 1, 2009
0.313
+0.061
24.32%
jan 1, 2010
0.299
-0.014
-4.41%
jan 1, 2011
0.266
-0.033
-11.2%
jan 1, 2012
0.248
-0.018
-6.7%
jan 1, 2013
0.261
+0.014
5.53%
jan 1, 2014
0.26
-0.002
-0.57%
jan 1, 2015
0.209
-0.051
-19.7%
jan 1, 2016
0.14
-0.069
-33.11%
Ranking of countries by current statistics by years


Comments: