29
/
en
AIzaSyAYiBZKx7MnpbEhh9jyipgxe19OcubqV5w
April 1, 2024
125973
El Salvador
SLV
true
2
1
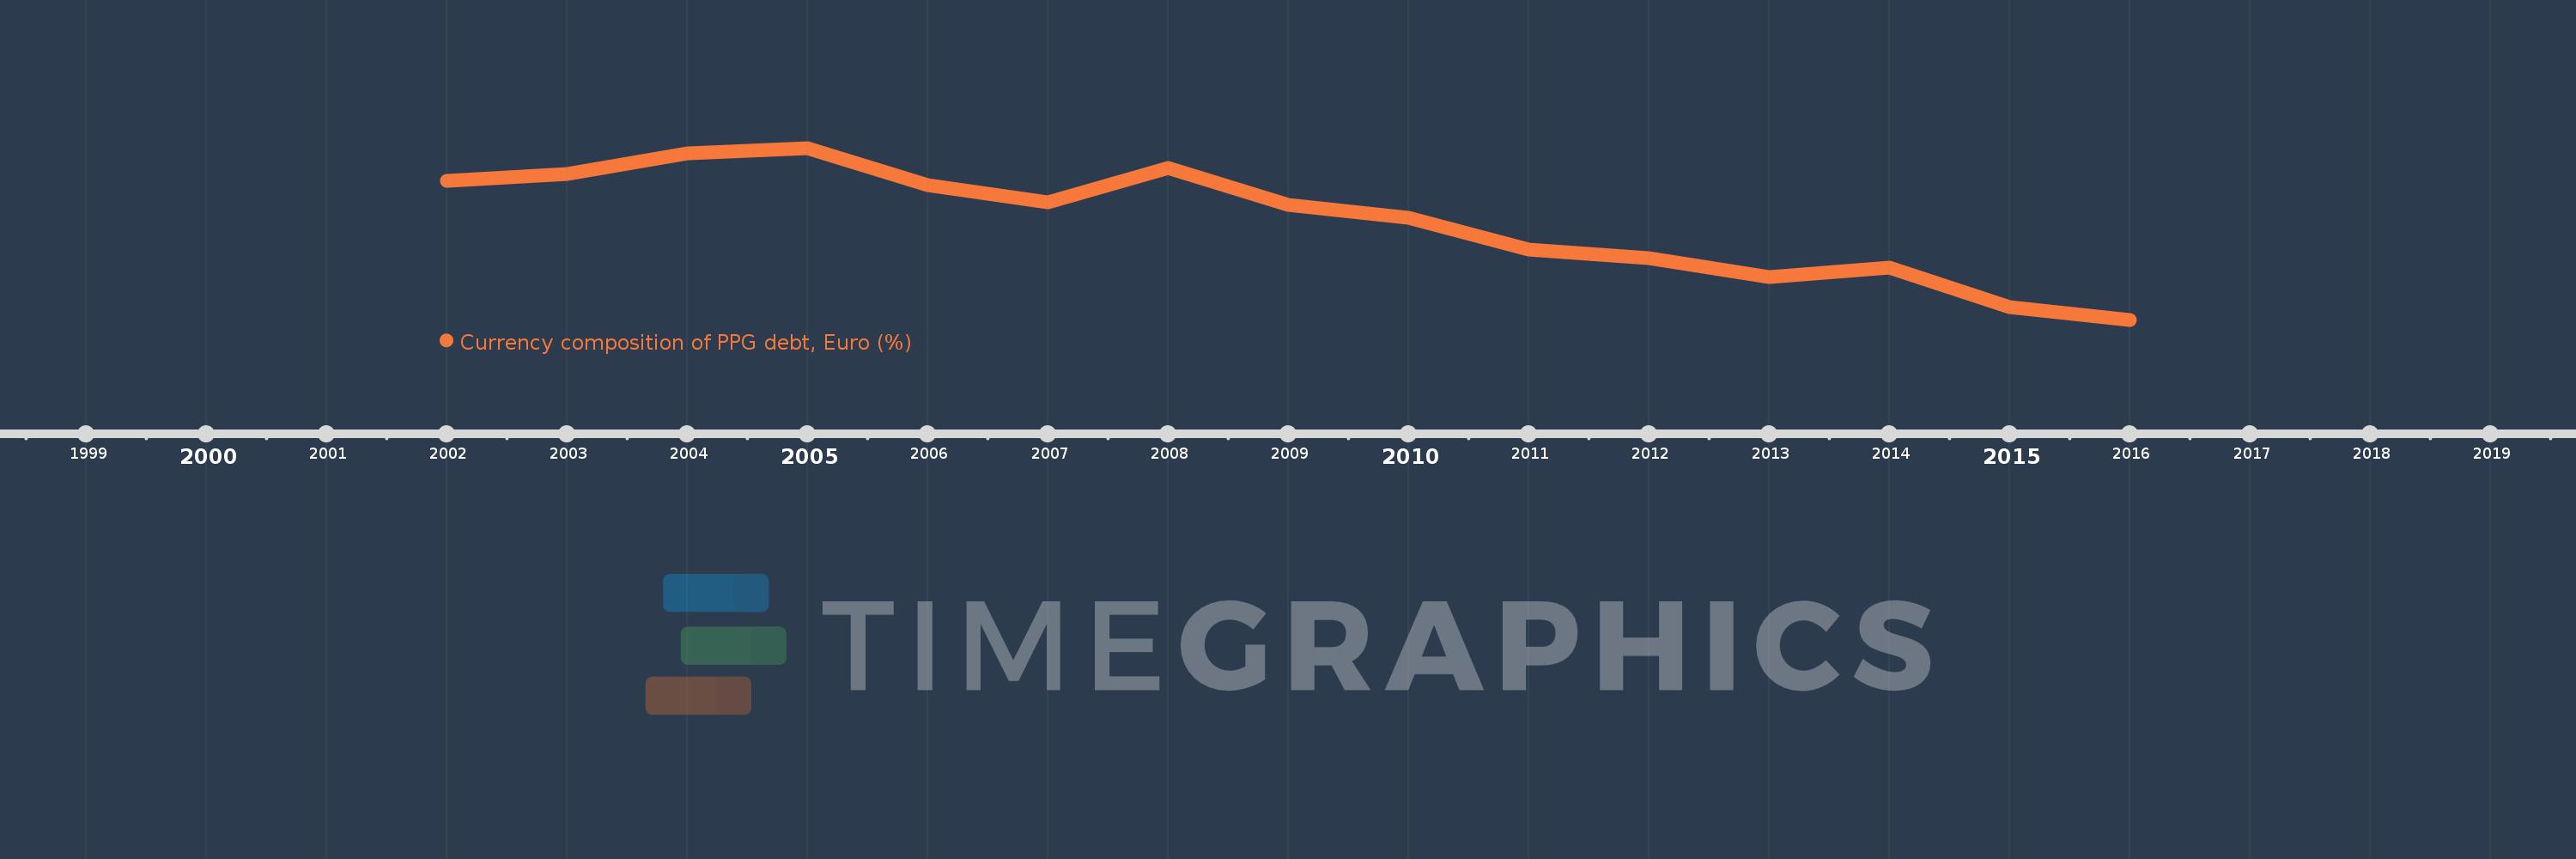
Currency composition of PPG debt, Euro (%)
2016,2015,2014,2013,2012,2011,2010,2009,2008,2007,2006,2005,2004,2003,2002
This statistics in other country:
Timeline:
This timeline shows a graph from 2002 to 2016 of El Salvador. No data until 2001. Number of actual observations by date: 15.
Source name:
World Development Indicators
Source organization:
World Bank, International Debt Statistics.
Categories, topics:
External Debt
Last updated:
apr 23, 2017
Indicators value changes by year
At the date of observation
Value
Absolute change
Change from previous value
jan 1, 2002
3.542
+3.542
0.0%
jan 1, 2003
3.633
+0.091
2.58%
jan 1, 2004
3.912
+0.279
7.66%
jan 1, 2005
3.979
+0.067
1.72%
jan 1, 2006
3.481
-0.498
-12.51%
jan 1, 2007
3.243
-0.238
-6.84%
jan 1, 2008
3.707
+0.464
14.29%
jan 1, 2009
3.21
-0.497
-13.4%
jan 1, 2010
3.043
-0.167
-5.21%
jan 1, 2011
2.61
-0.433
-14.23%
jan 1, 2012
2.493
-0.116
-4.46%
jan 1, 2013
2.246
-0.248
-9.93%
jan 1, 2014
2.374
+0.129
5.74%
jan 1, 2015
1.836
-0.539
-22.7%
jan 1, 2016
1.67
-0.166
-9.04%
Ranking of countries by current statistics by years


Comments: