29
/
en
AIzaSyAYiBZKx7MnpbEhh9jyipgxe19OcubqV5w
April 1, 2024
269127
Turkey
TUR
true
2
1
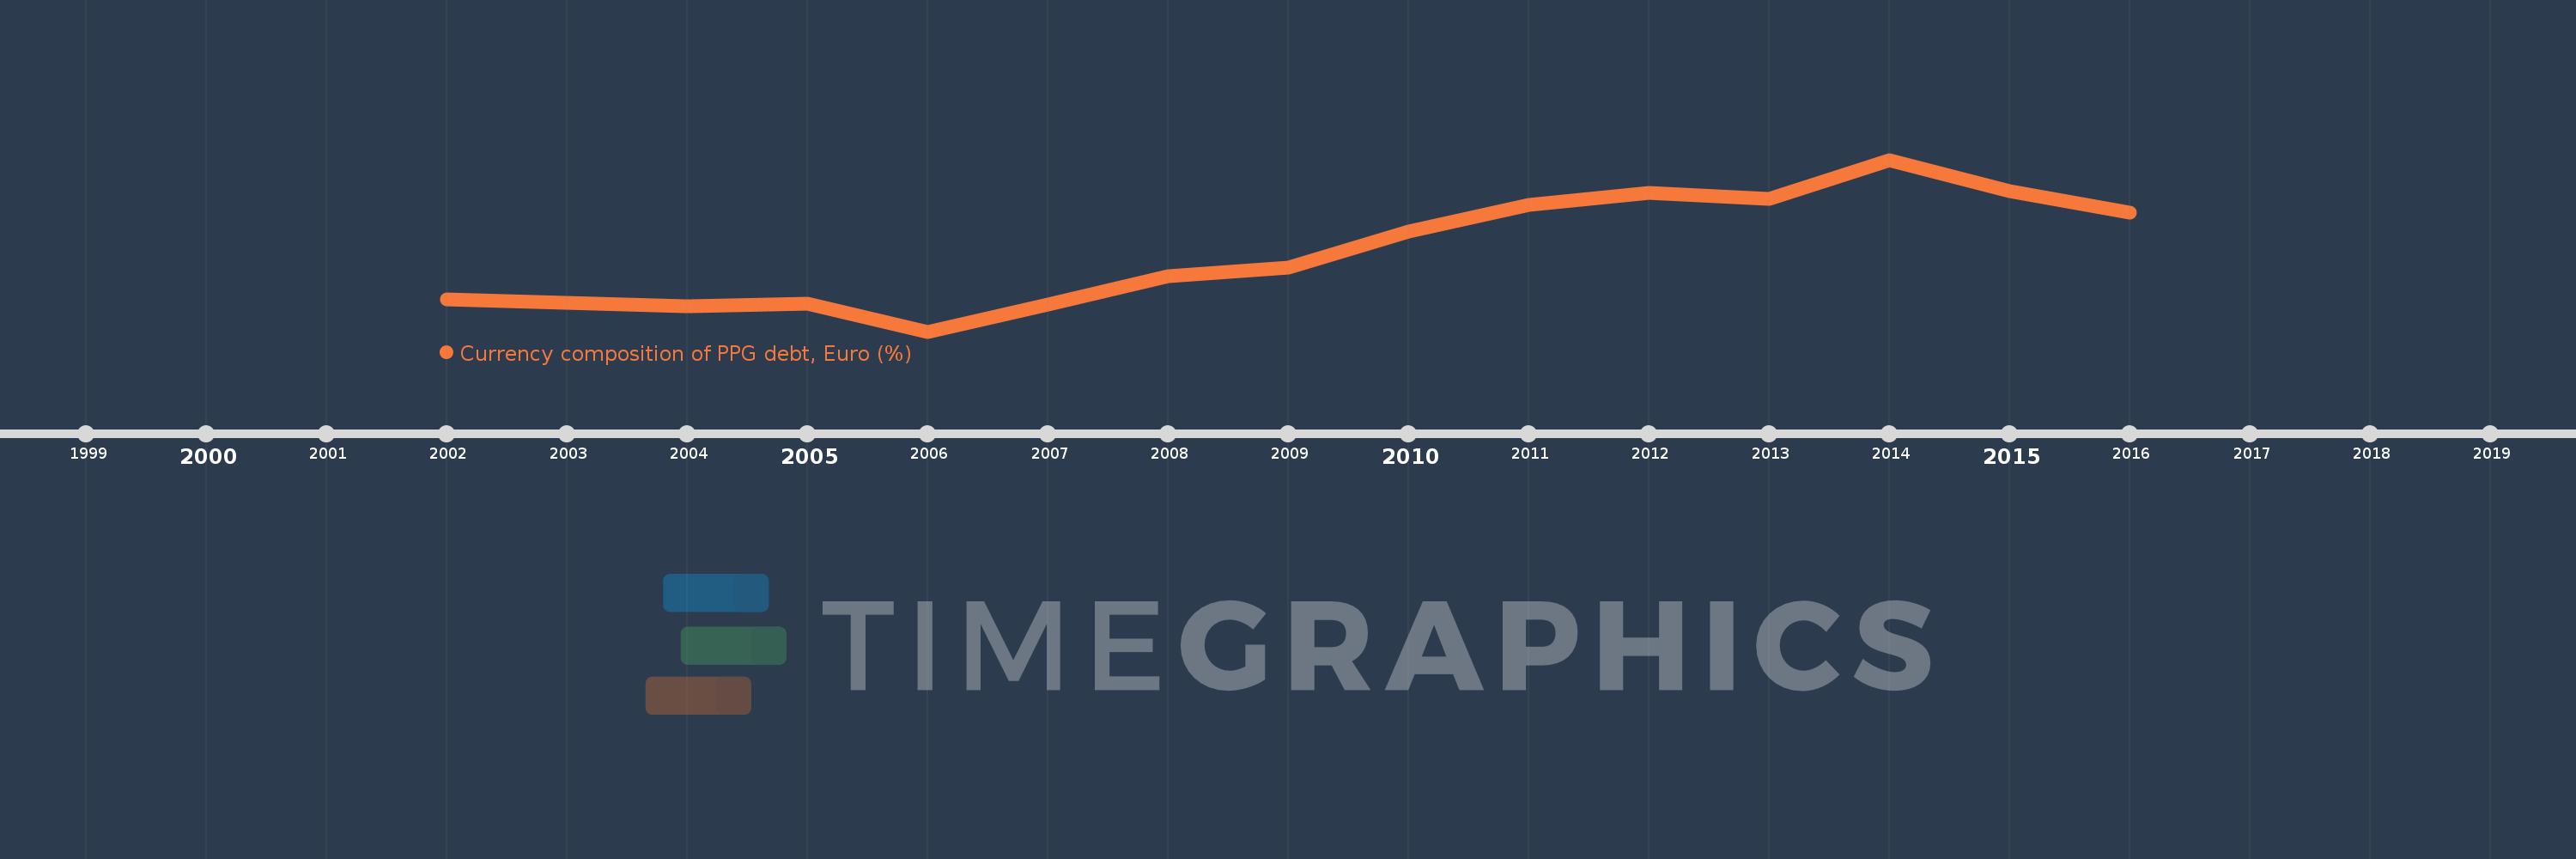
Currency composition of PPG debt, Euro (%)
2016,2015,2014,2013,2012,2011,2010,2009,2008,2007,2006,2005,2004,2003,2002
This statistics in other country:
Timeline:
This timeline shows a graph from 2002 to 2016 of Turkey. No data until 2001. Number of actual observations by date: 15.
Source name:
World Development Indicators
Source organization:
World Bank, International Debt Statistics.
Categories, topics:
External Debt
Last updated:
apr 23, 2017
Indicators value changes by year
Minimum:
23.395
jan 1, 2006
Maximum:
33.798
jan 1, 2014
At the date of observation
Value
Absolute change
Change from previous value
jan 1, 2002
25.328
+25.328
0.0%
jan 1, 2003
25.158
-0.169
-0.67%
jan 1, 2004
24.93
-0.228
-0.91%
jan 1, 2005
25.068
+0.138
0.55%
jan 1, 2006
23.395
-1.672
-6.67%
jan 1, 2007
25.056
+1.66
7.1%
jan 1, 2008
26.728
+1.672
6.67%
jan 1, 2009
27.273
+0.545
2.04%
jan 1, 2010
29.447
+2.174
7.97%
jan 1, 2011
31.065
+1.619
5.5%
jan 1, 2012
31.806
+0.741
2.38%
jan 1, 2013
31.41
-0.396
-1.25%
jan 1, 2014
33.798
+2.387
7.6%
jan 1, 2015
31.915
-1.883
-5.57%
jan 1, 2016
30.577
-1.338
-4.19%
Ranking of countries by current statistics by years


Comments: