29
/
en
AIzaSyAYiBZKx7MnpbEhh9jyipgxe19OcubqV5w
April 1, 2024
273377
Ukraine
UKR
true
2
1
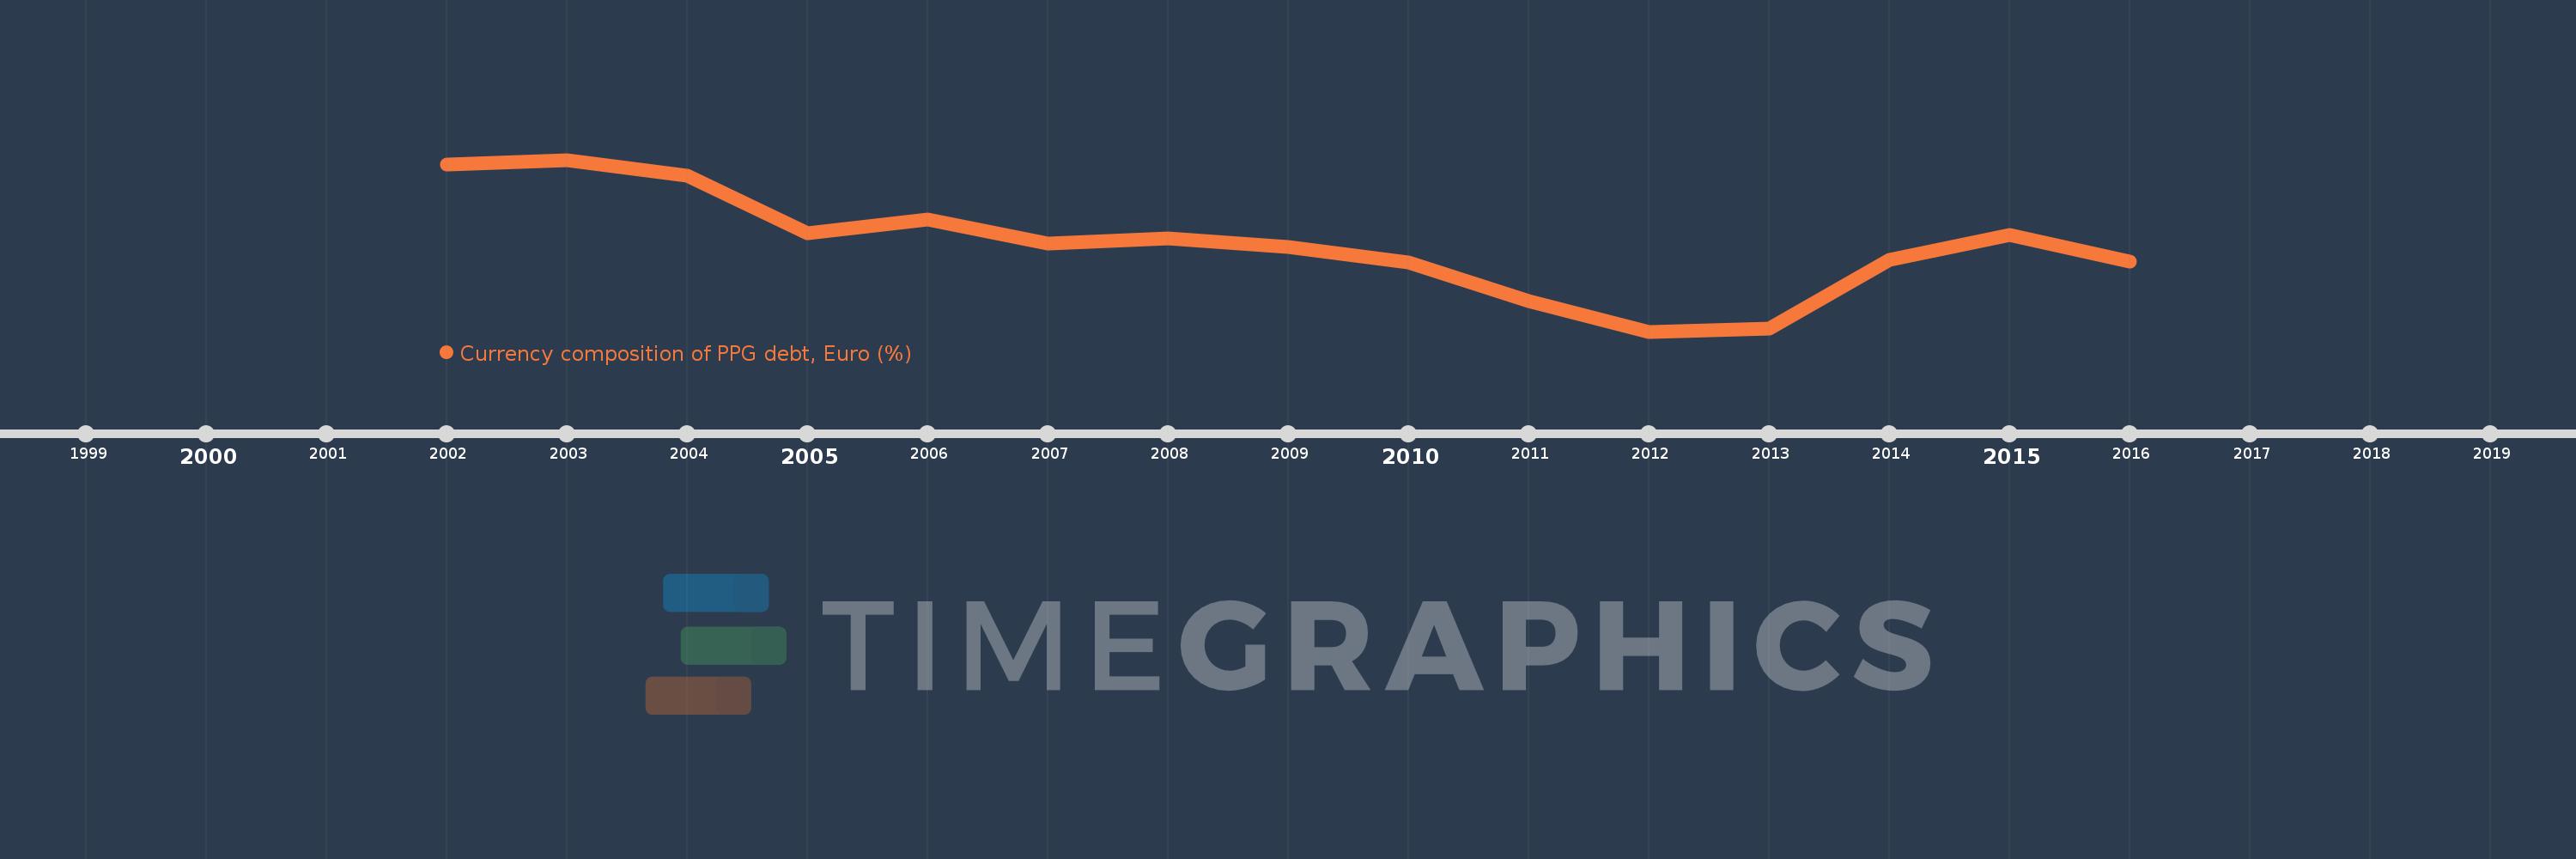
Currency composition of PPG debt, Euro (%)
2016,2015,2014,2013,2012,2011,2010,2009,2008,2007,2006,2005,2004,2003,2002
This statistics in other country:
Timeline:
This timeline shows a graph from 2002 to 2016 of Ukraine. No data until 2001. Number of actual observations by date: 15.
Source name:
World Development Indicators
Source organization:
World Bank, International Debt Statistics.
Categories, topics:
External Debt
Last updated:
apr 23, 2017
Indicators value changes by year
Maximum:
23.021
jan 1, 2003
At the date of observation
Value
Absolute change
Change from previous value
jan 1, 2002
22.564
+22.564
0.0%
jan 1, 2003
23.021
+0.458
2.03%
jan 1, 2004
21.47
-1.552
-6.74%
jan 1, 2005
15.897
-5.573
-25.96%
jan 1, 2006
17.23
+1.334
8.39%
jan 1, 2007
14.913
-2.317
-13.45%
jan 1, 2008
15.393
+0.48
3.22%
jan 1, 2009
14.597
-0.796
-5.17%
jan 1, 2010
13.076
-1.521
-10.42%
jan 1, 2011
9.299
-3.777
-28.88%
jan 1, 2012
6.37
-2.929
-31.5%
jan 1, 2013
6.682
+0.312
4.89%
jan 1, 2014
13.347
+6.665
99.74%
jan 1, 2015
15.717
+2.371
17.76%
jan 1, 2016
13.129
-2.589
-16.47%
Ranking of countries by current statistics by years


Comments: